Learning Microsoft Power BI Lesson 4 – Exploring Power BI Service
The post “Learning Microsoft Power BI Lesson 4” takes you through the over view and interacting with Power BI Service. We have created an account at Office 365 and using to log into Power BI Service:
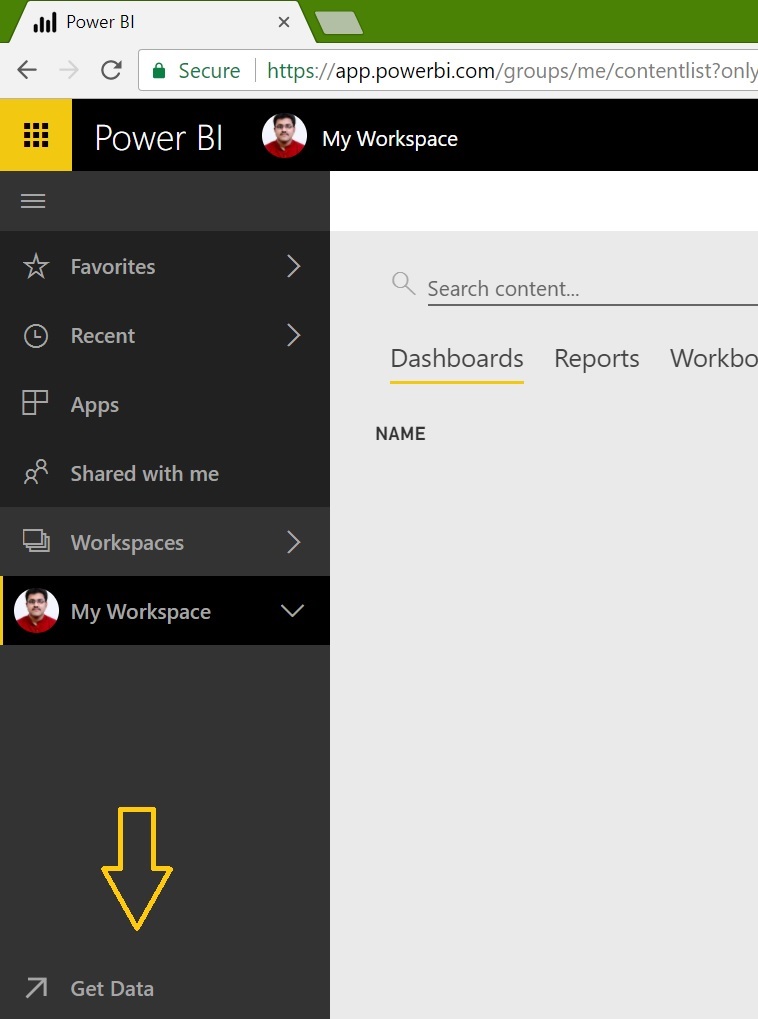
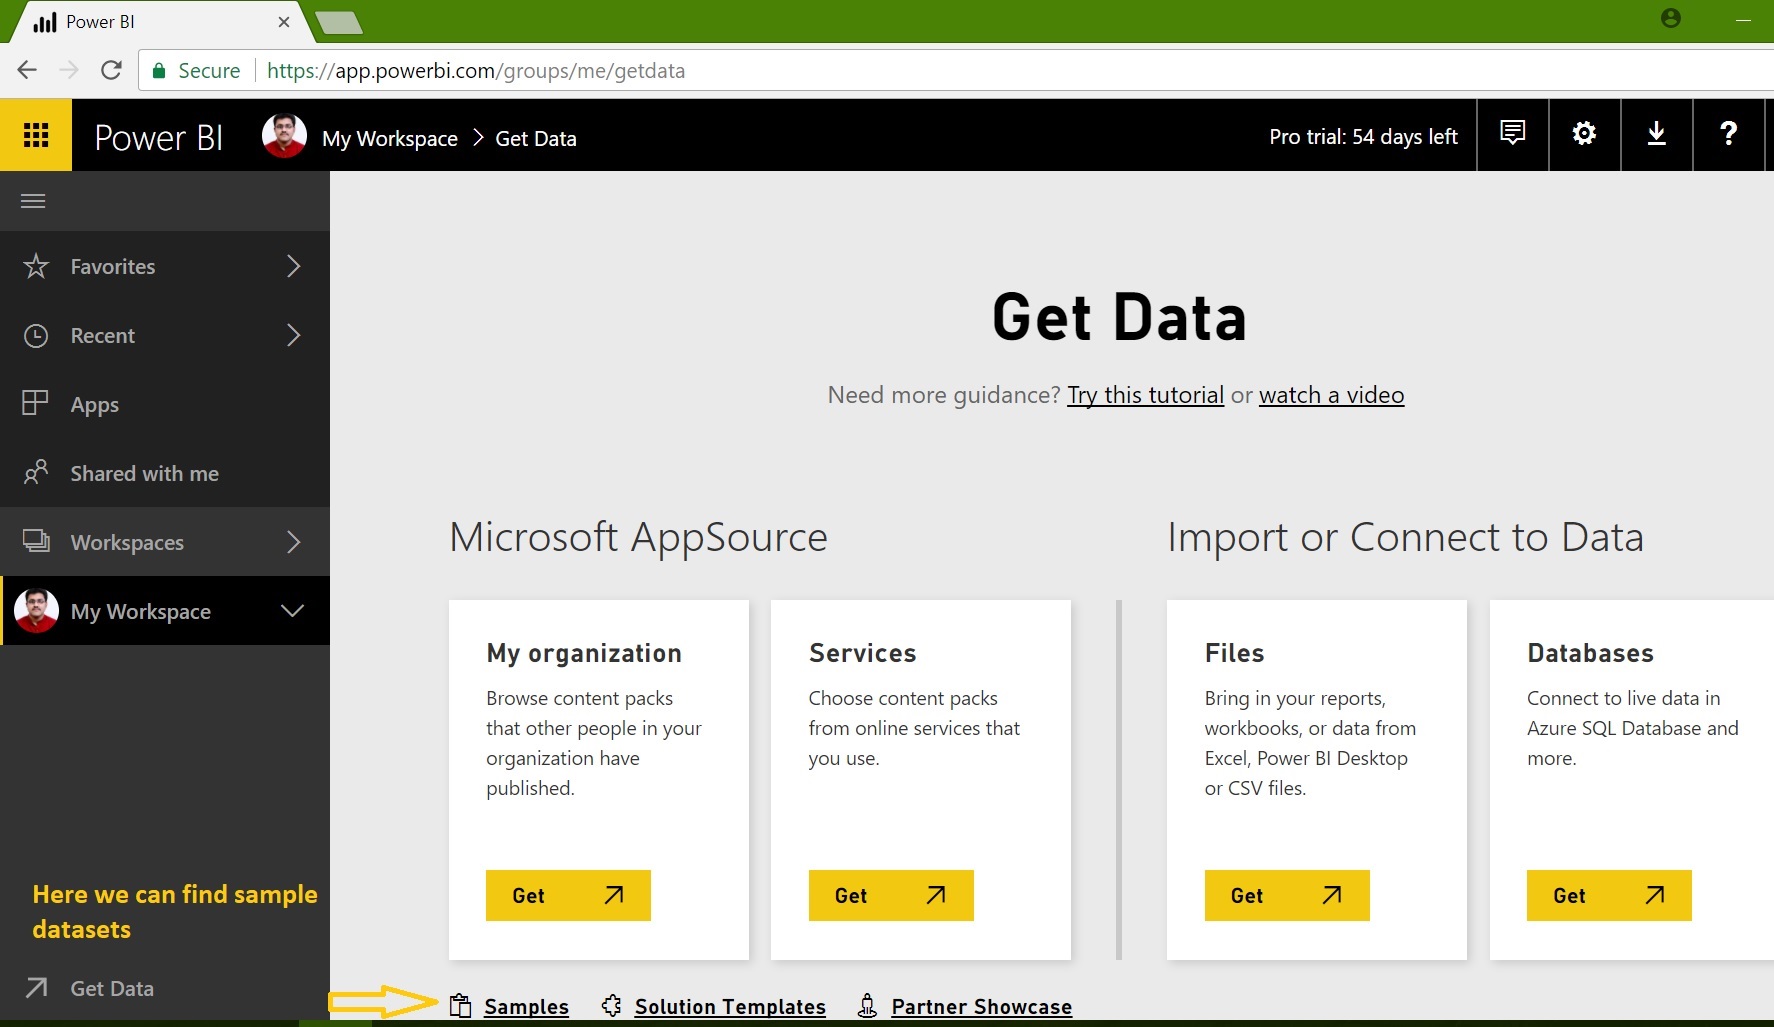
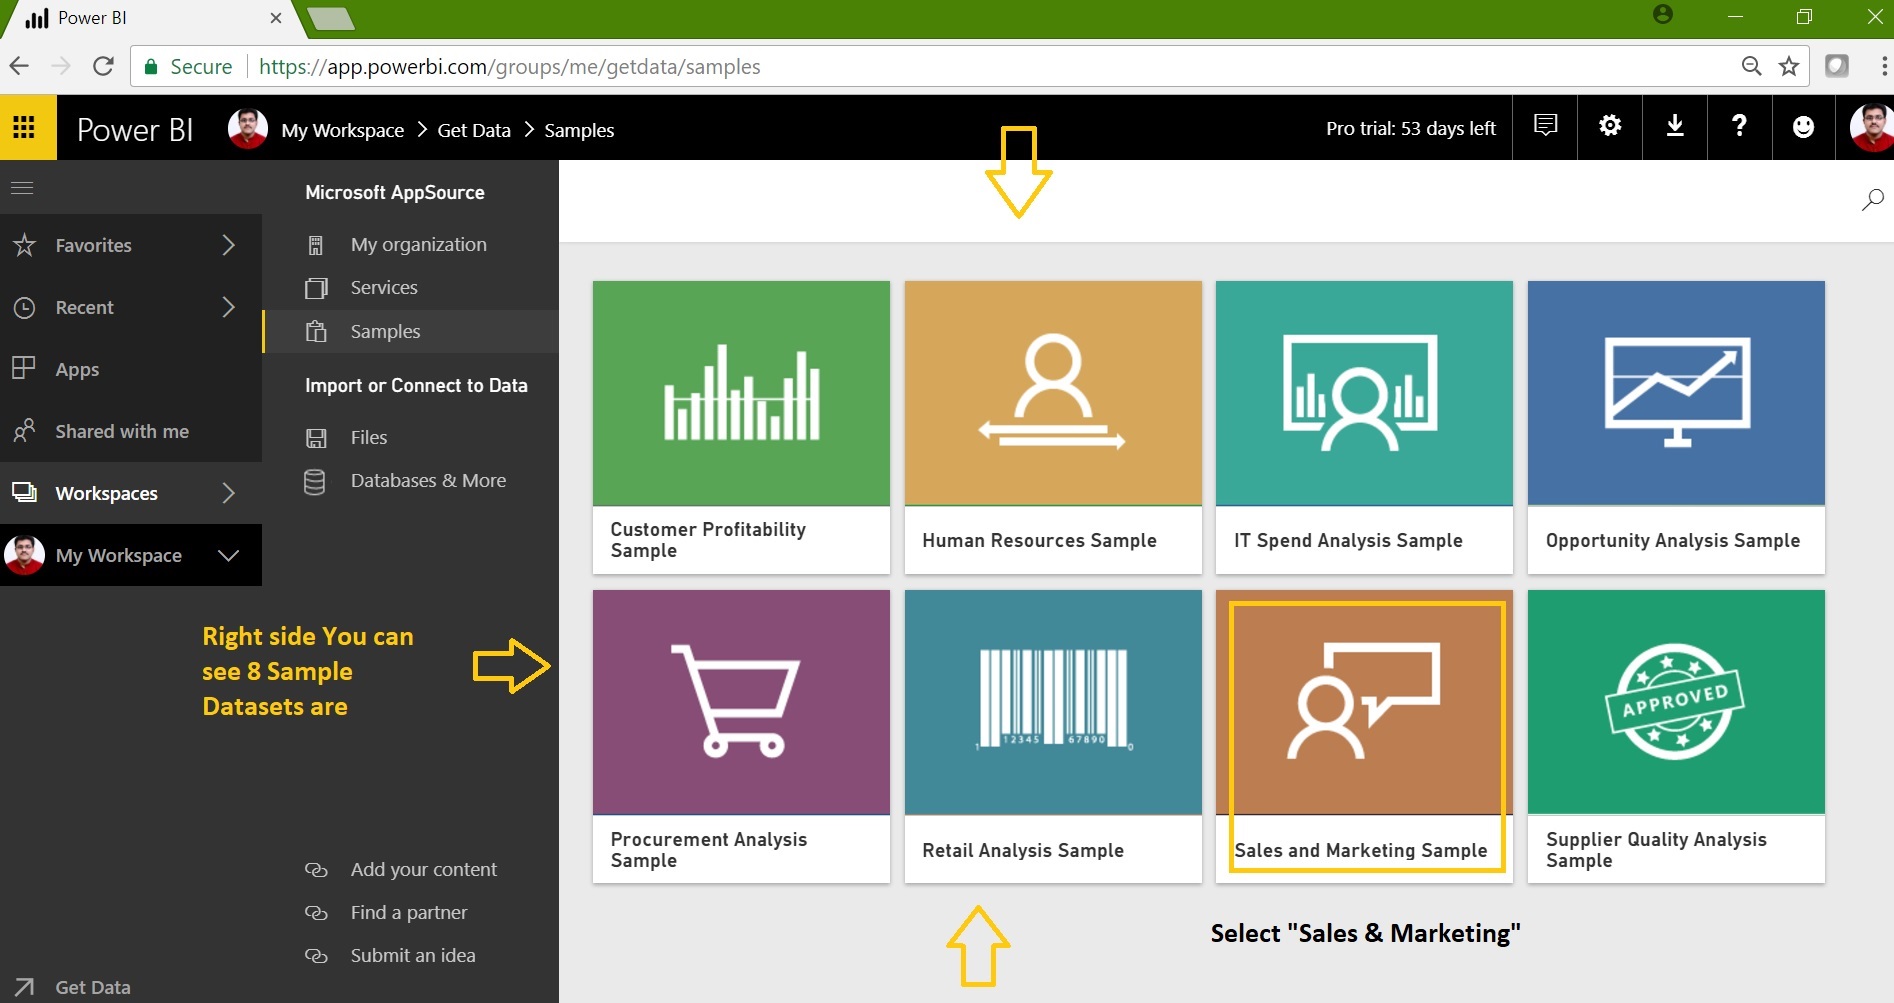
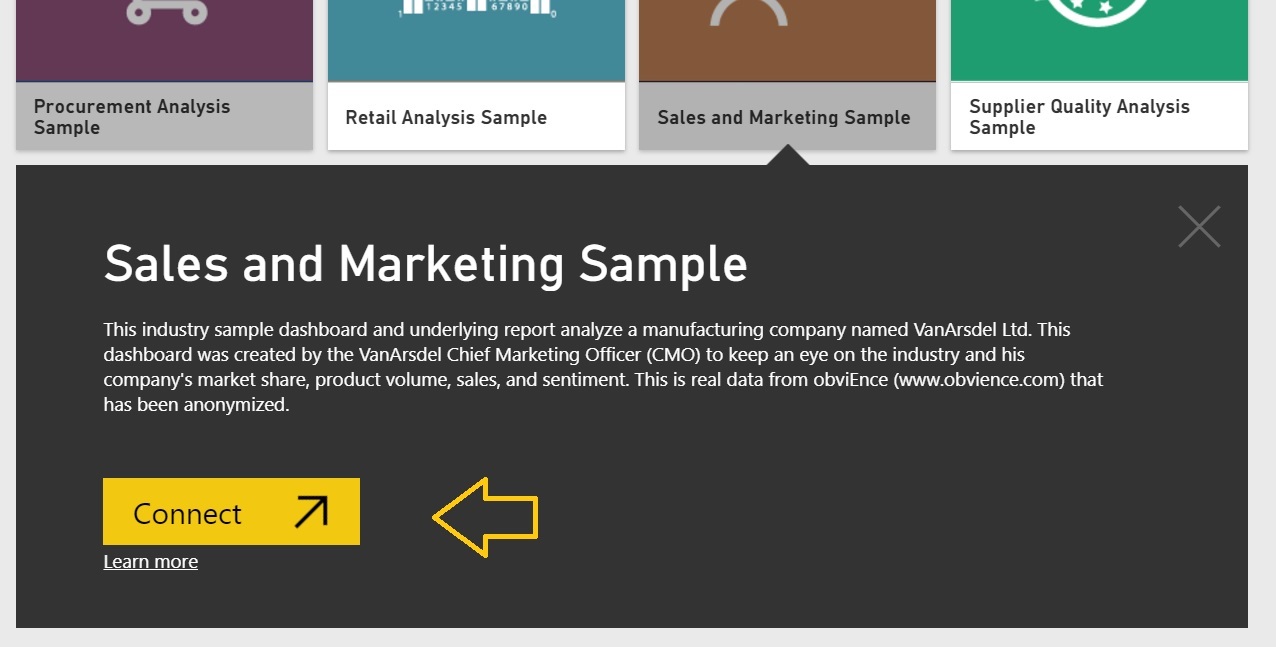
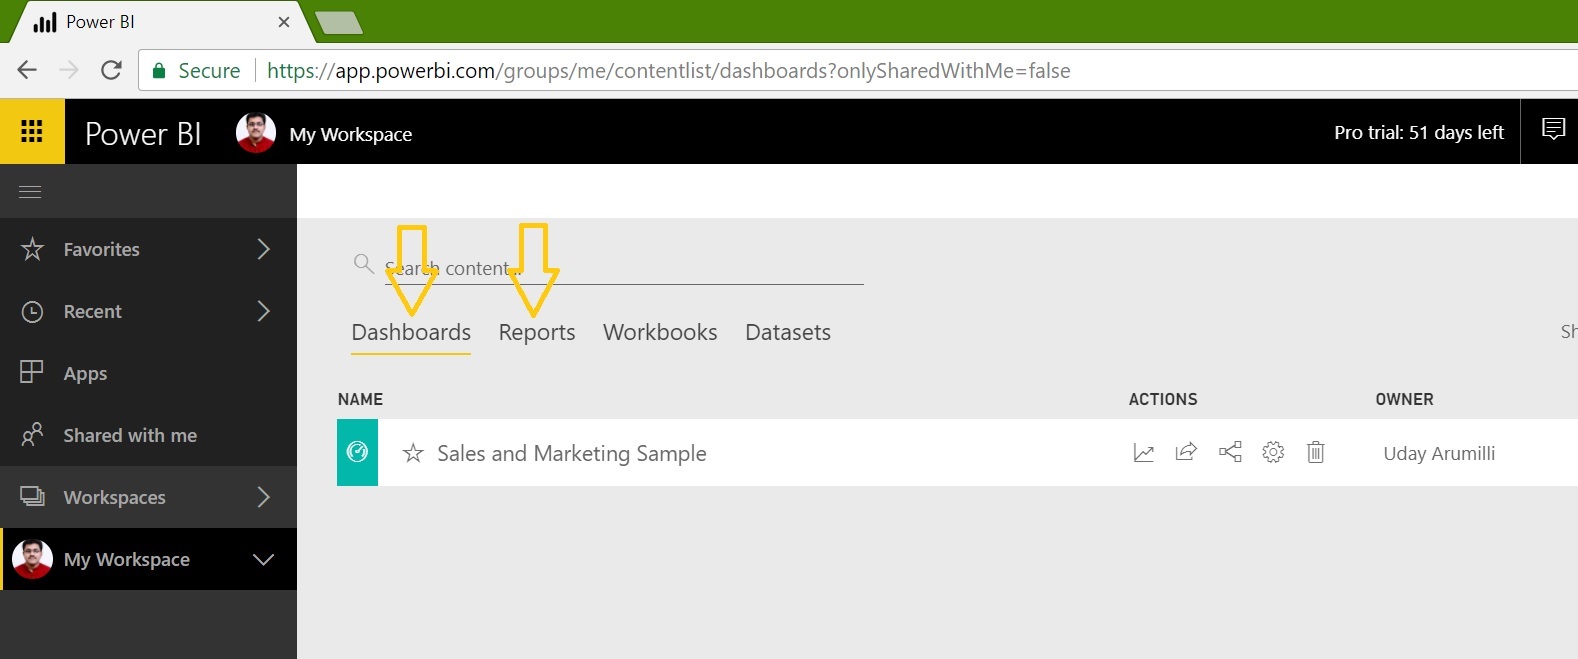
We’ll explorer Power BI service with the Sample Datasets available:
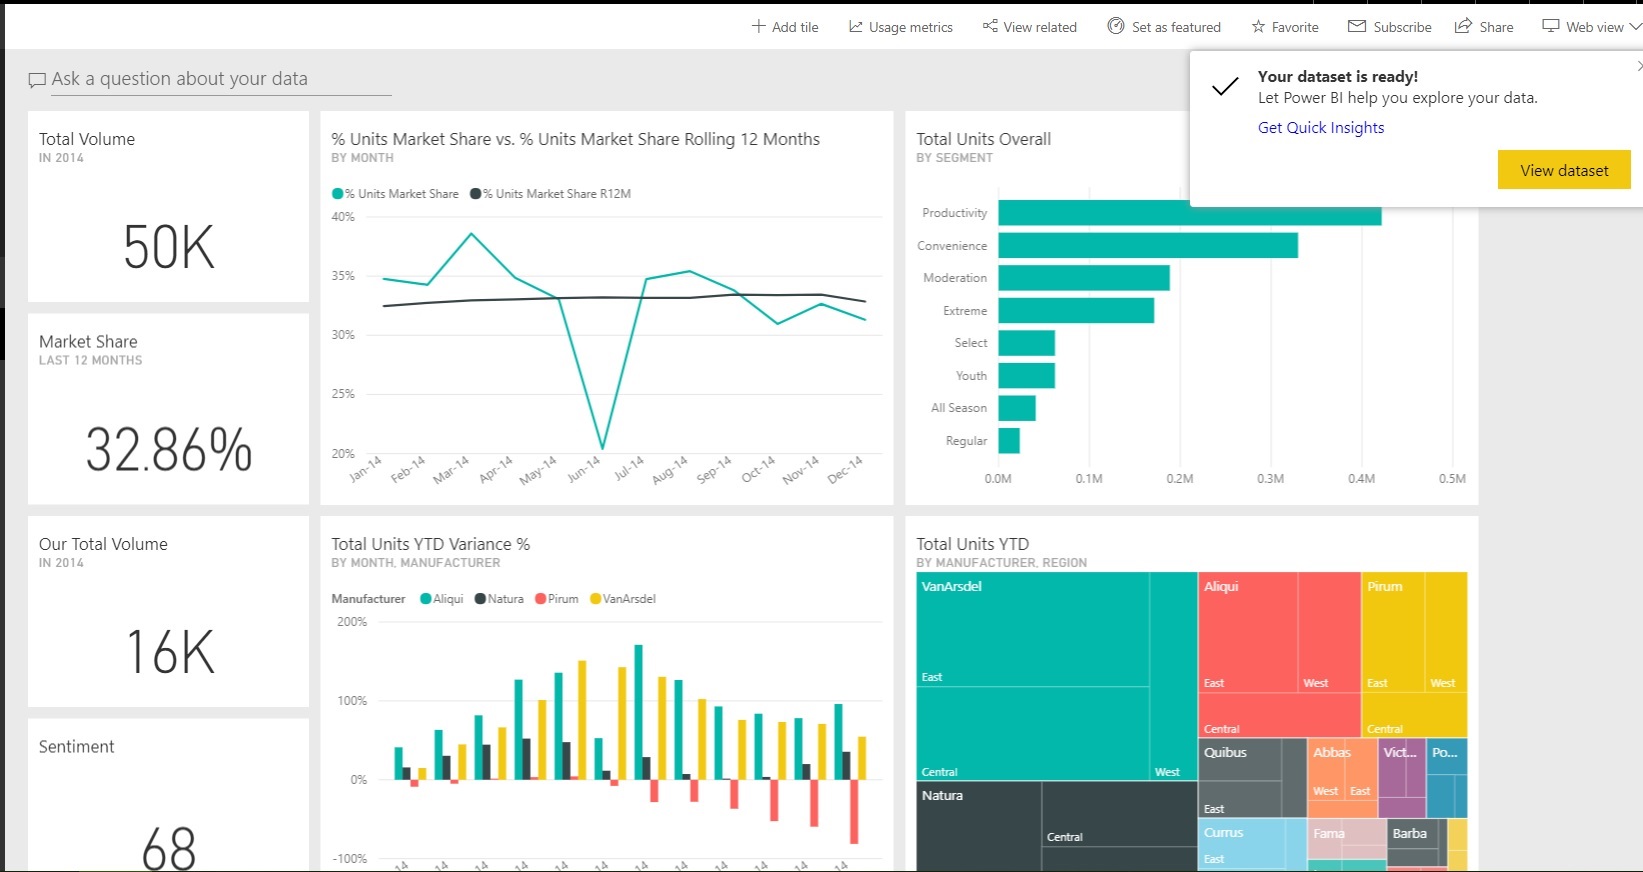
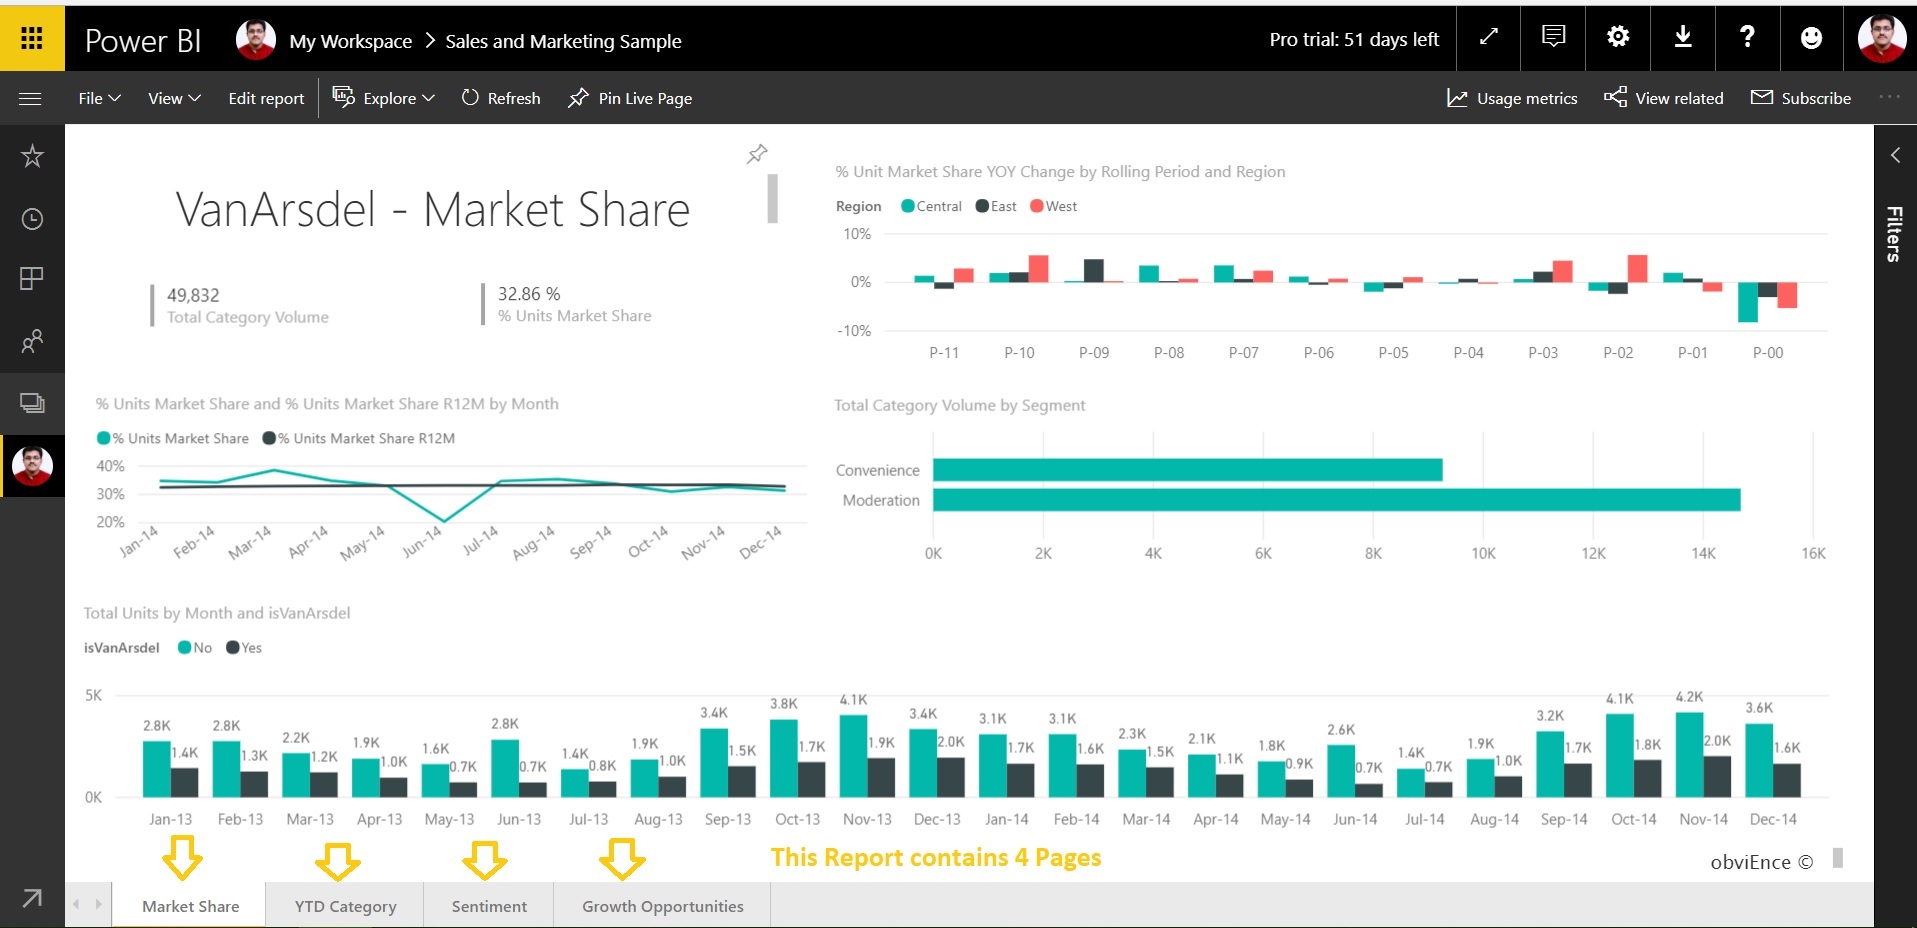
The moment you connect to the “Sales and Marketing” dataset, it connects to the sample dataset and creates a Dashboard and report with a set of visuals as shown in below:
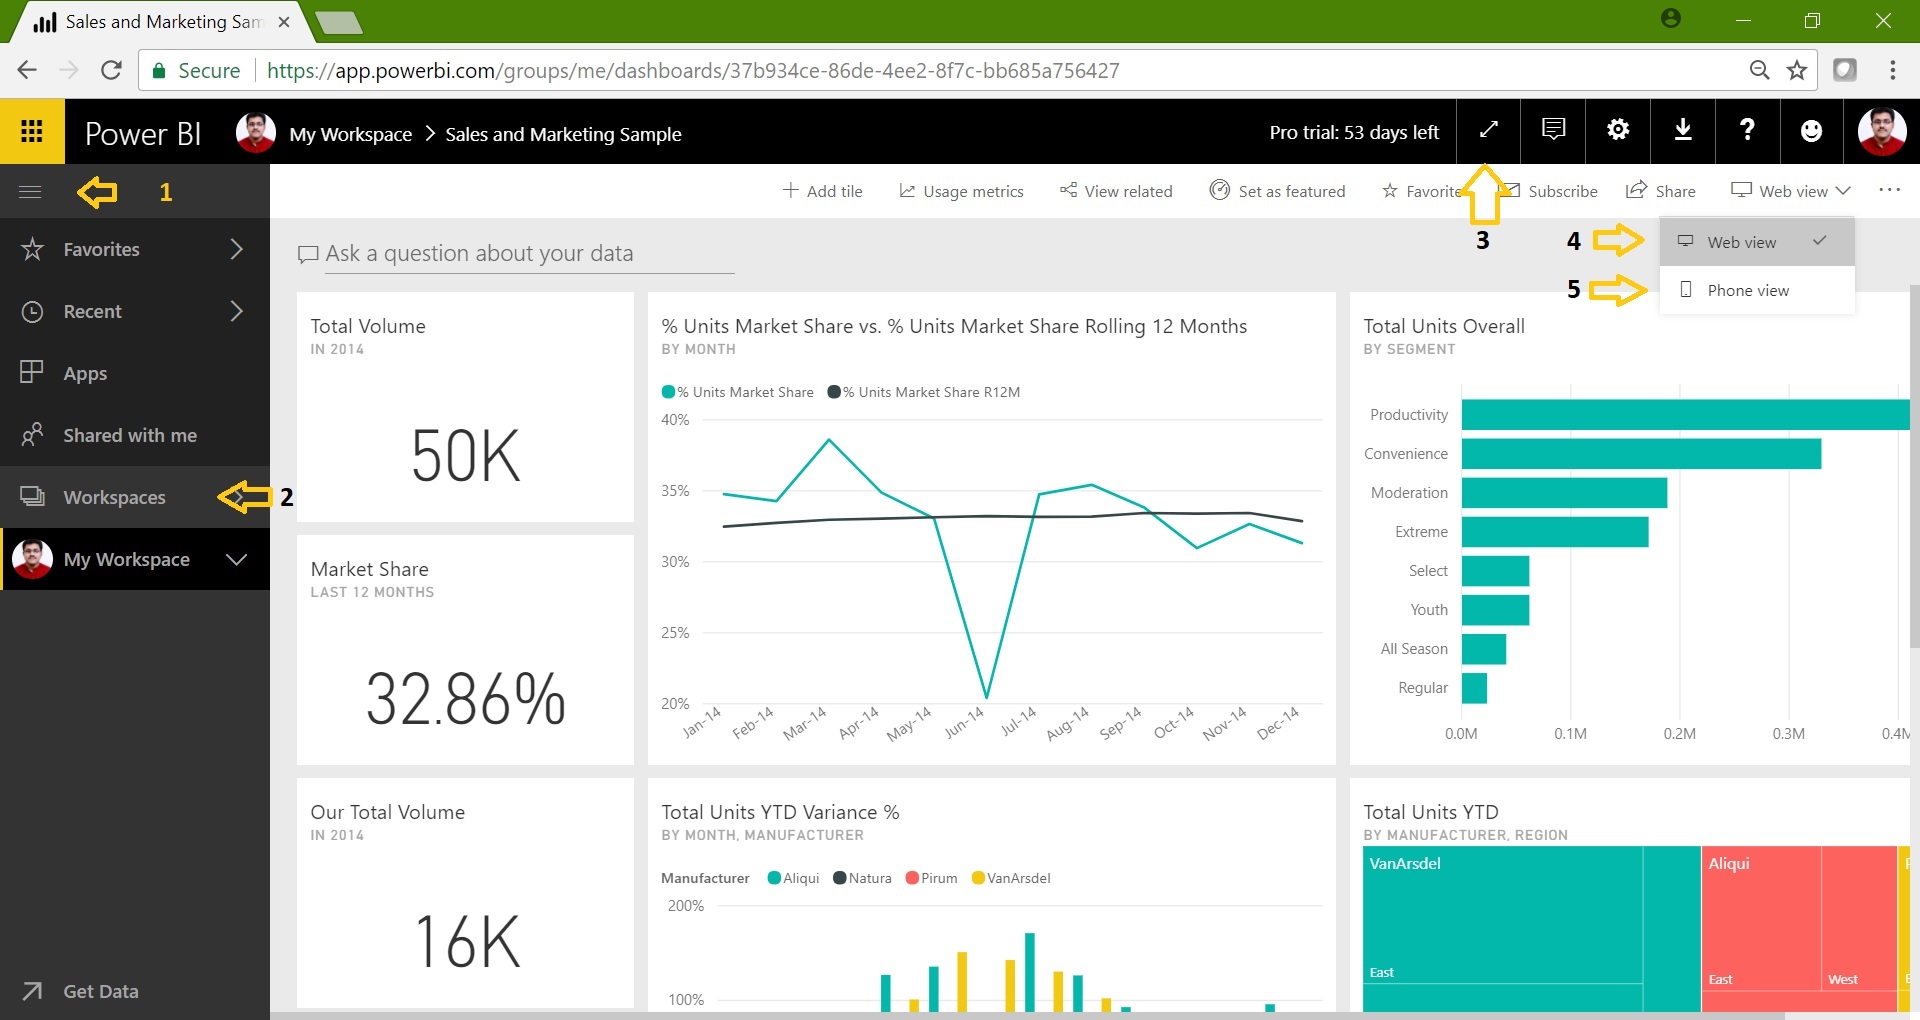
We can observe various things from below Screen:
Hide / View Navigation Pane
Available Workspaces
Enter Full Screen Mode
Viewing the report in Web view mode
Viewing the report in Mobile view mode
Let’s view the report in mobile mode:
Power BI automatically creates Dashboard and Report using the sample datasets:
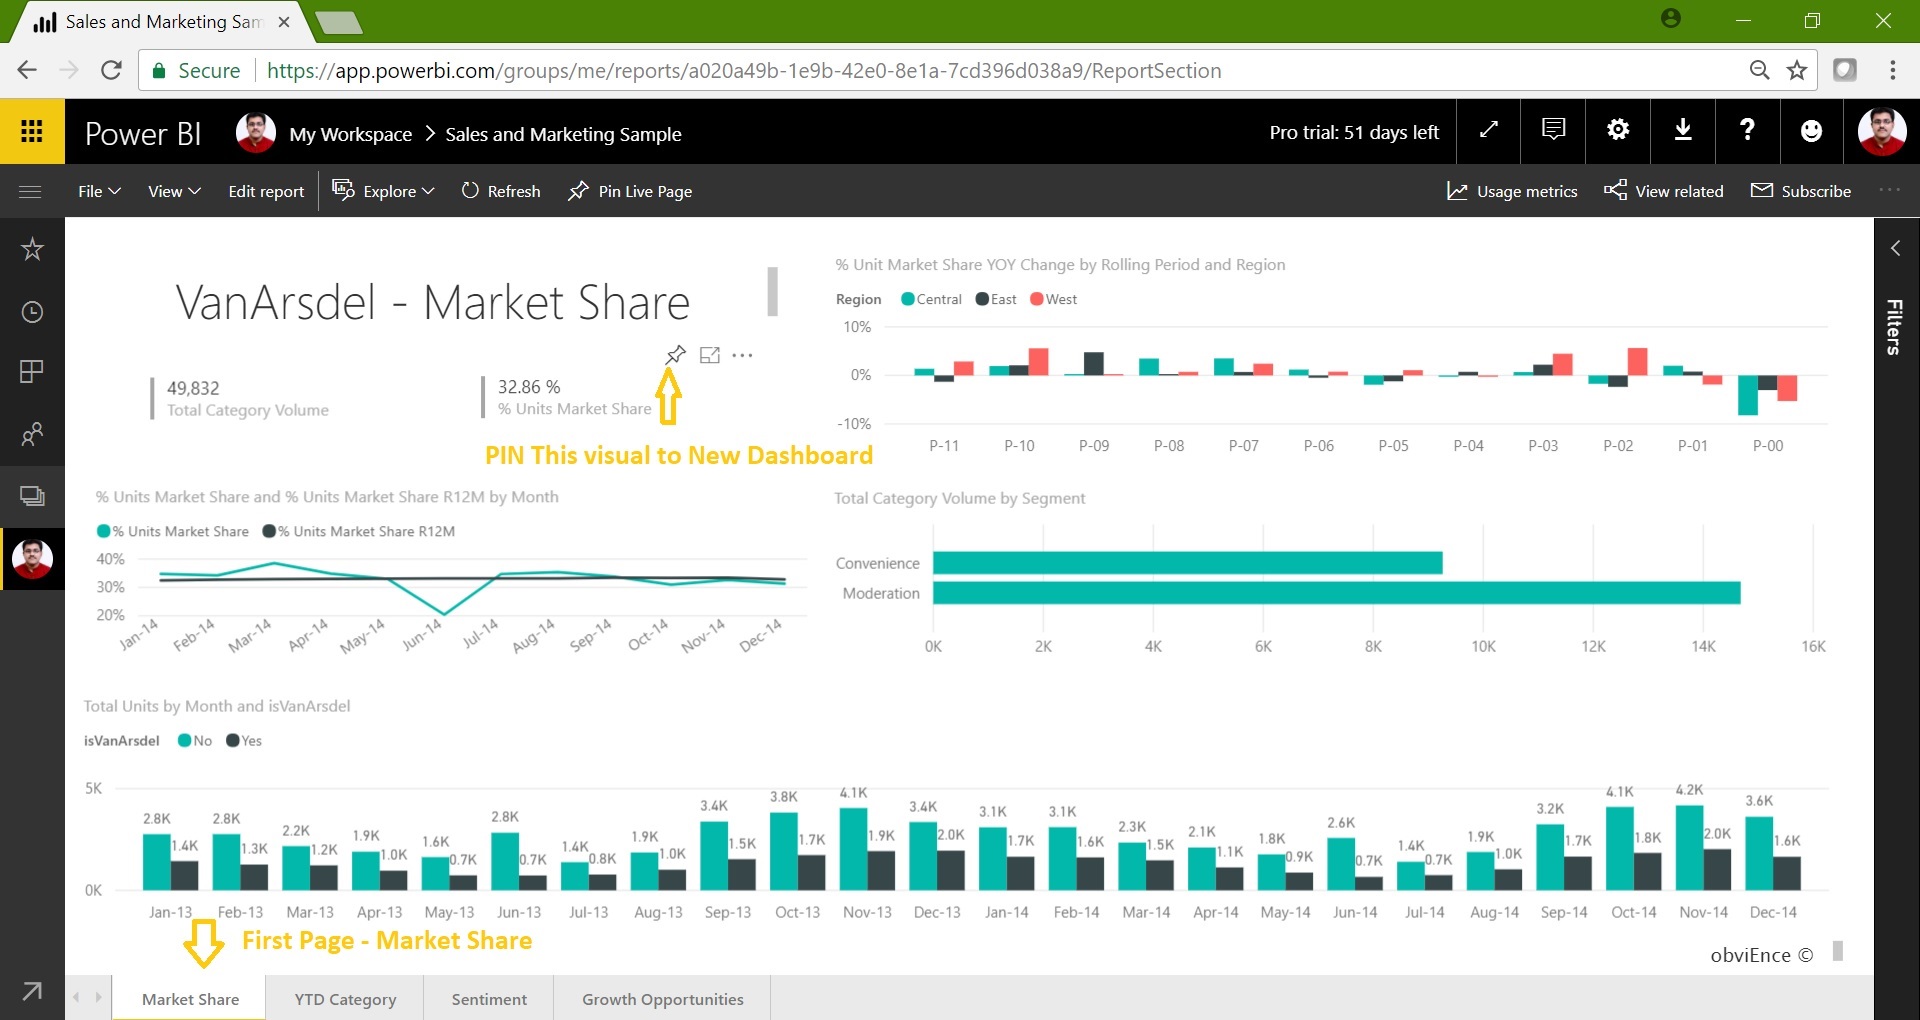
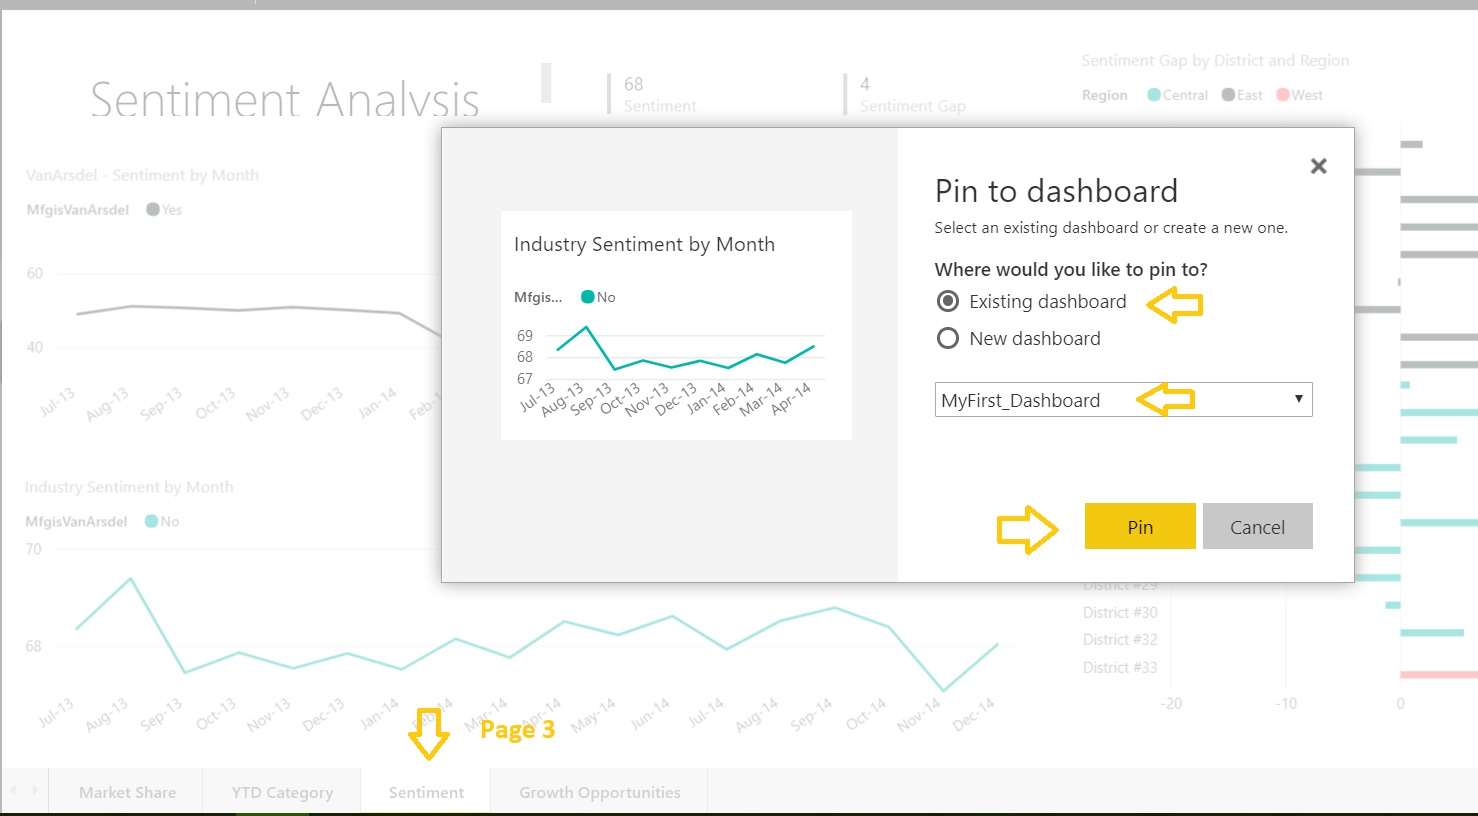
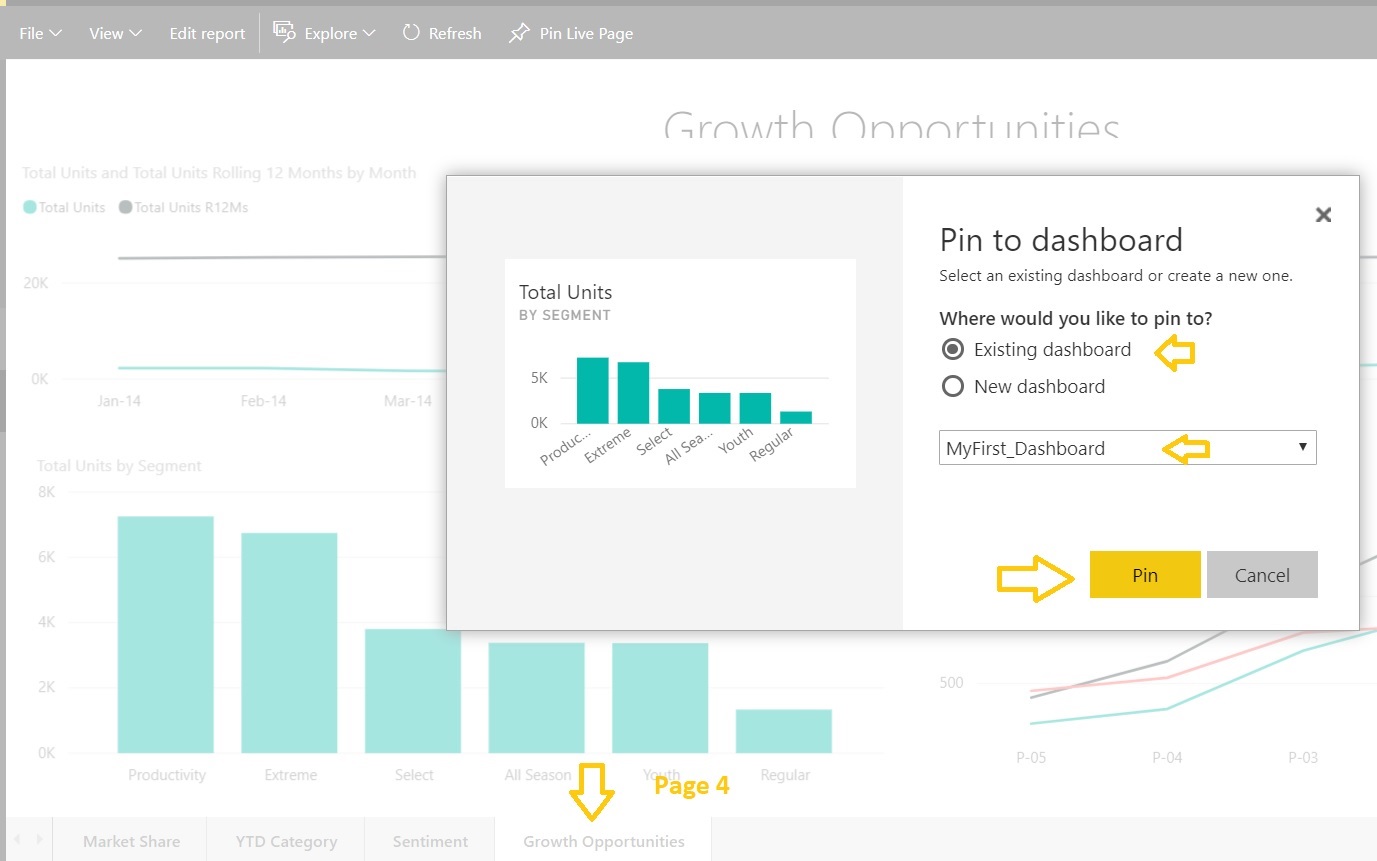
From the default report created from sample dataset we’ll prepare a new dashboard by adding specific visuals from each page:
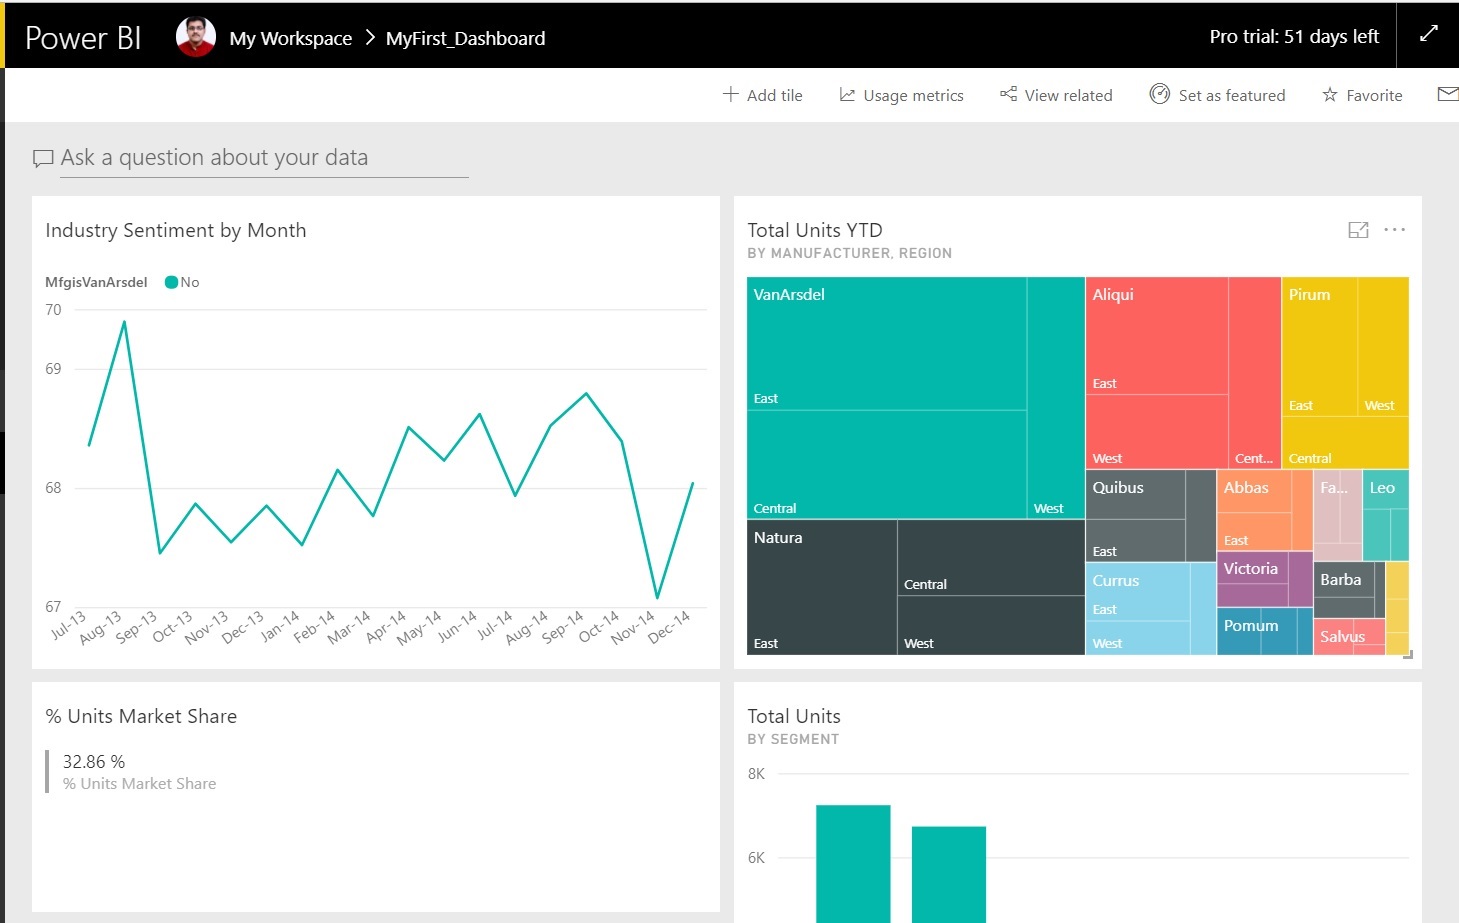
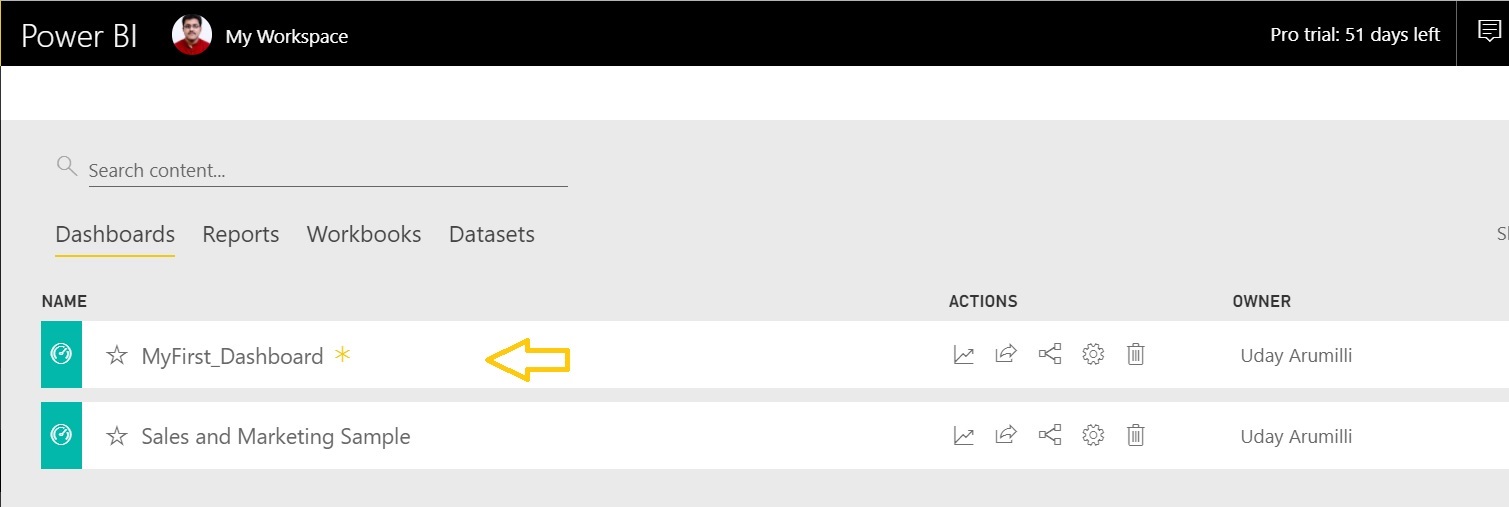
Go back to My “Work Space” and from Dashboards we can see the newly created Dashboard
Summary:
We have interacted with the Power BI Service interface
Connected to sample dataset and observed how reports and dashboards are created
Created “MyFirst_Dashboard” using the visuals / tiles from the existing report
Thanks for your post. This is excellent information. The list of your blogs is very helpful for those who want to learn, It is amazing!!! You have been helping many application. http://www.bestseleniumtraininginchennai.in/
Very nice post here thanks for it .I always like and such a super contents of these post.Excellent and very cool idea and great content of different kinds of the valuable information’s.

 Learning Microsoft Power BI Lesson 4 – Exploring Power BI Service
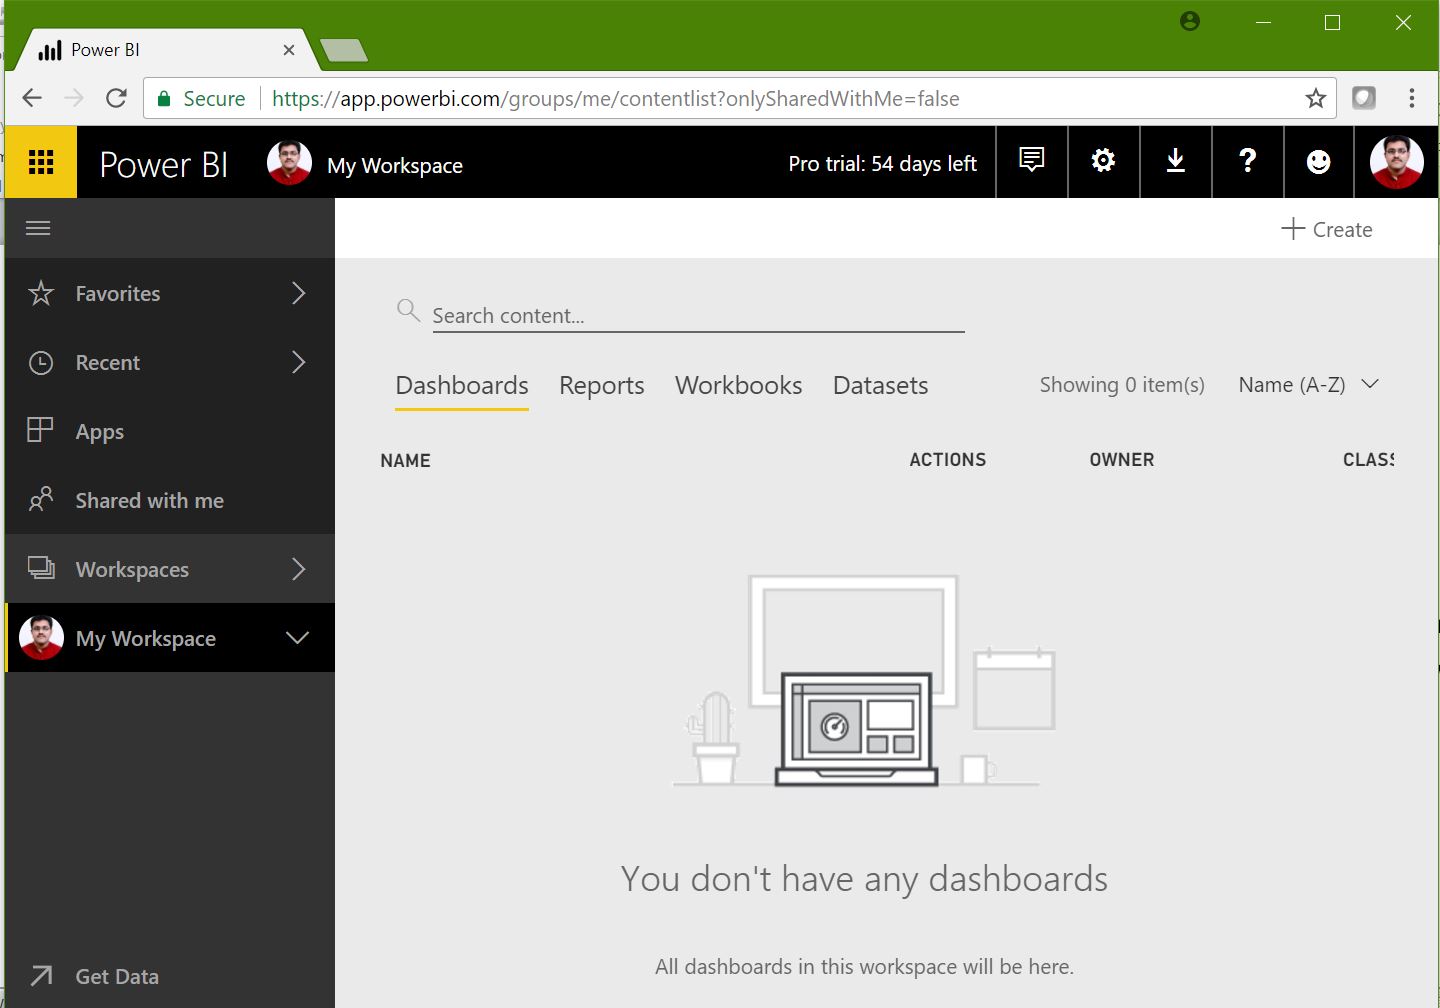


Thanks for your post. This is excellent information. The list of your blogs is very helpful for those who want to learn, It is amazing!!! You have been helping many application.
http://www.bestseleniumtraininginchennai.in/
Very nice post here thanks for it .I always like and such a super contents of these post.Excellent and very cool idea and great content of different kinds of the valuable information’s.
Thank you so much for your information,its very useful and helful to me.Keep updating and sharing. Thank you.
RPA training in chennai | UiPath training in chennai
thanks for shadata science training in bangalore
data science classroom training in bangalore
best training institute for data science in bangalore
best data science training institute in bangalore
data science with python training in bangalore
best data science training in bangalore
tableau training in bangalore
best tableau training institutes in bangalore
tableau classroom training in bangalorering this information
Excellent Blog. Thank you so much for sharing.
best react js training in chennai
react js training in Chennai
react js workshop in Chennai
react js courses in Chennai
react js training institute in Chennai