
The post “Learning Microsoft Power BI Lesson 1” is the introduction lesson for Power BI. We would like to concentrate more on implementing rather than theory but before that we should understand basic things:
Q. Where we can find the Power BI software?
Ans:
Here is the link to download Power BI desktop cersion.
Click on Start Free Download Free
Install the downloaded software
Q. Does Microsoft provides any documentation / Tutorial?
Ans:
Yes! Microsoft is providing the guided learning tutorial
Here is the link for the Microsoft Power BI Tutorial.
Q. What are the main components of Power BI?
Ans:
Below are the components of Power BI. These are released to market separately also we can use these components individually.
Power BI Desktop: Desktop application for developing BI reports
Power BI Service: SaaS (Soft as a Service) cloud based solution for authoring and sharing the BI reports
Power BI Mobile App: Power BI supports mobile OS Android, iOS and Windows.
Power Query: Is a free add-in for Excel (2010 & 2013) and embedded in Excel 2016. It allows users an easy way to discover, combine and refine data all within the familiar Excel interface.
Power Pivot: Is an In-memory tabular data modelling tool, it’s a free add-in for Excel 2010 and embedded from Excel 2013 and higher.
Power View: It’s a data visualization tool that lets you create interactive charts, graphs, maps, and other visuals. It’s a free add-in from Excel 2013
Power Map: It’s a 3 Dimensional data visualization tool. It’s a free add-in for Excel 2013 and embedded as a “3D Maps” in Excel 2016
Power Q&A: Natural language question and answering engine, it doesn’t require any separate installation or add-in.
Q. What are the Building Blocks of Power BI?
Ans:
Before going to learn designing the first reports we should understand the building blocks of Power BI. Below are the basic building blocks in Power BI:
- Visualizations
- Datasets
- Reports
- Dashboards
- Tiles
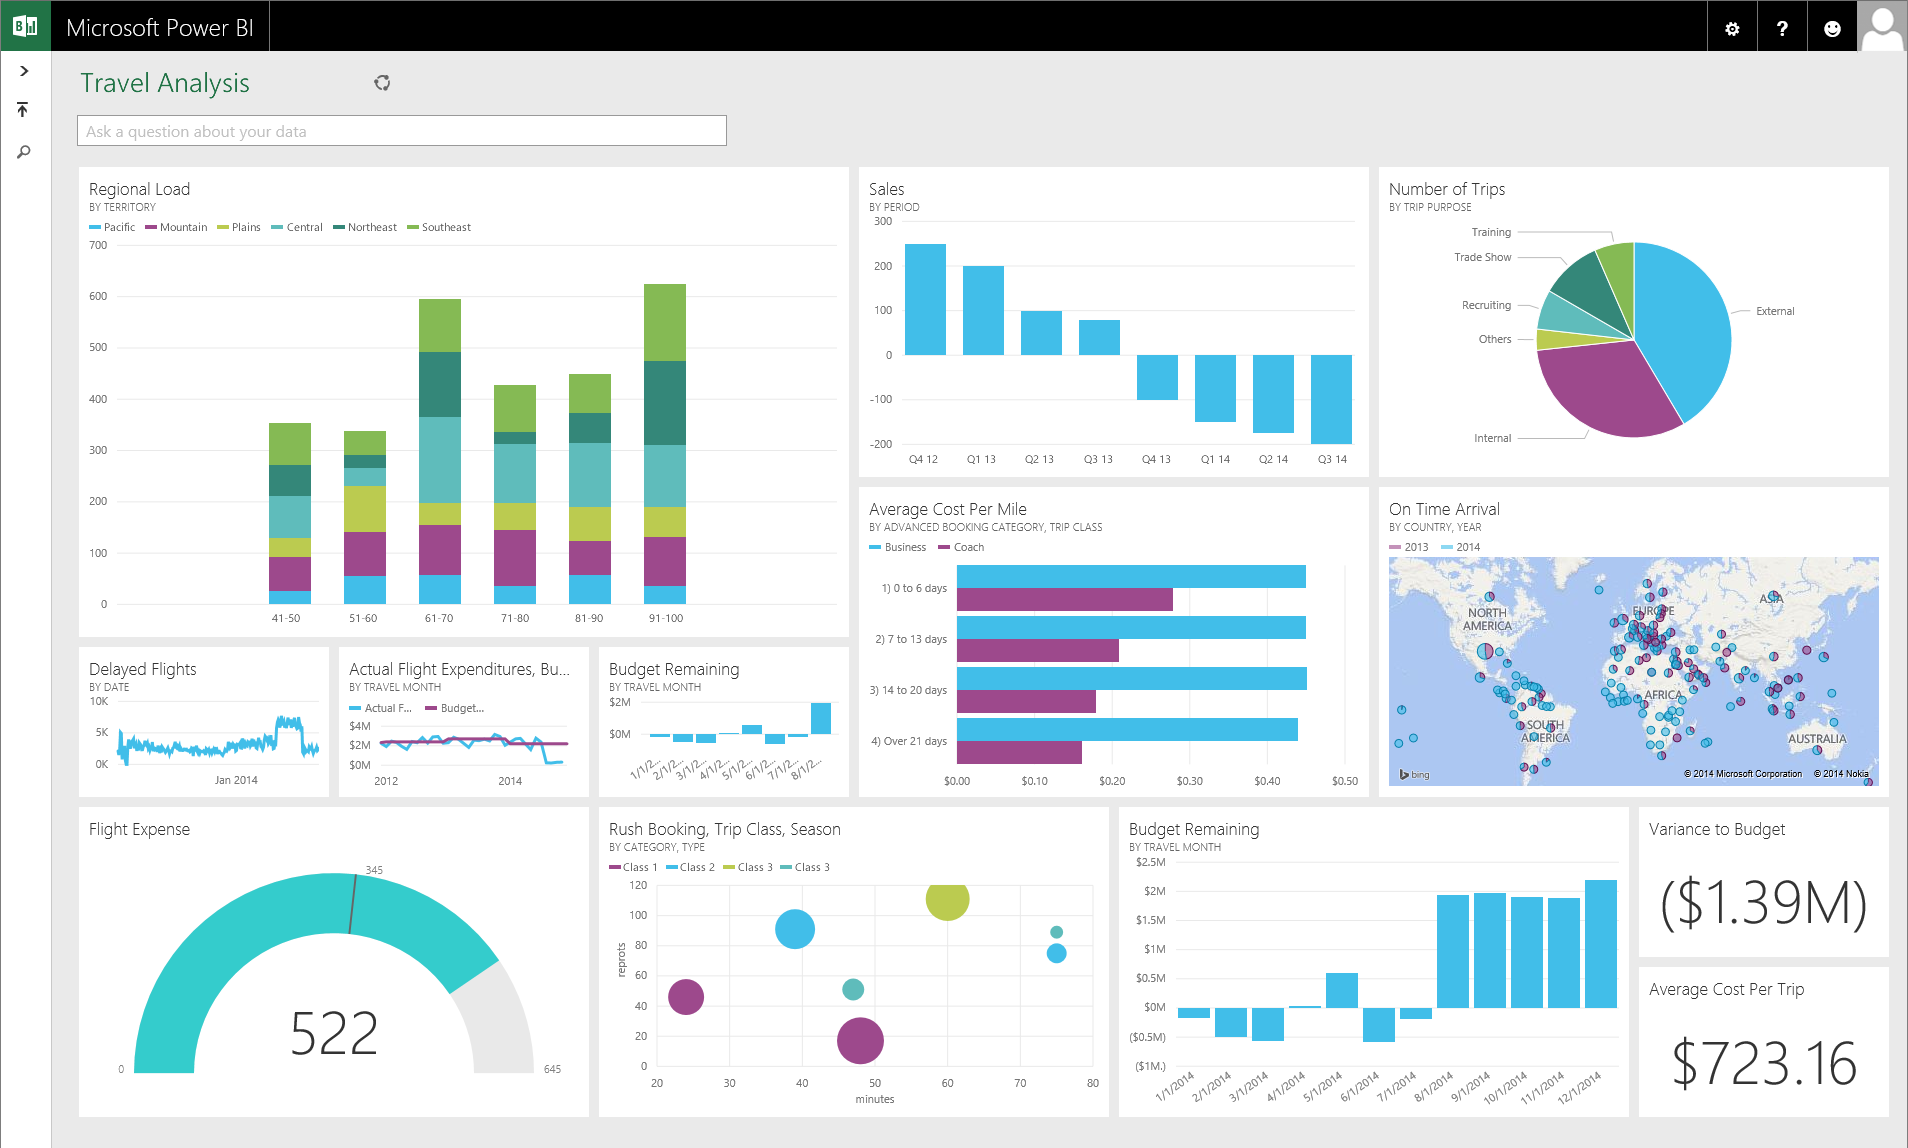
Visualizations: A visualization (sometimes also referred to as a visual) is a visual representation of data, such as a chart, a graph, a color-coded map, or other interesting things you can create to represent your data visually. Below image shows a collection of different visualizations regarding travel analysis:
Dataset: Is a source / Input for Power BI to create visualizations. It can also get data from multiple sources such as SQL Server, Excel, MySQL etc.
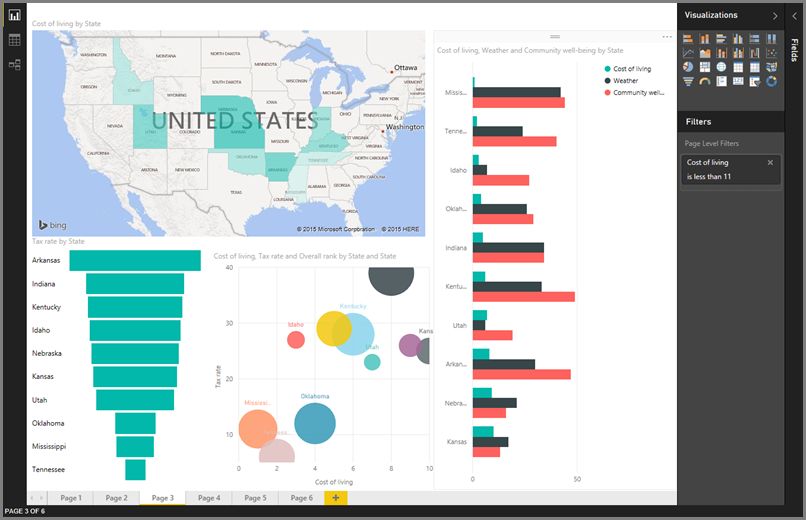
Reports: A report is a collection of visualizations that appear together in one or more pages. Ex: Representing product sales for a division. Based on the business requirement we can represent and organize visualizations in one or more pages. Below we are viewing the Page 3 from a 6page report:
Dashboards: A dash board represents a single page from a report or a group of visualizations. It’s just like a Dashboard in Cricket, in your Car, your user dashboard in Insurance portal, e-store user dashboard etc.
Tiles: A tile is a single visualization in a dashboard. It’s the rectangular box that contains each individual visual.
Summary:
Here in this introduction lesson we have gone through:
- Power BI software details
- Microsoft tutorial details
- Power BI Components
- Building Blocks of Power BI
In Next Lesson we will focus on setting up Power BI Desktop and Power BI Service.


Good Job Uday
Uday Sir,
Nice initiative on Power BI, Looking forward to cover all aspects of PBI.
[…] About Power BI, Power BI Introduction […]
[…] Power BI Lesson 1 […]
[…] Power BI Lesson 1 […]