Learning Microsoft Power BI Lesson 3 – Exploring Power BI Desktop
The post “Learning Microsoft Power BI Lesson 3” takes you through the overview and creating the first report using Power BI desktop. Here we have seen how to install the Power BI Desktop on Windows. Now we’ll open it and explore the features:
Power BI Desktop:
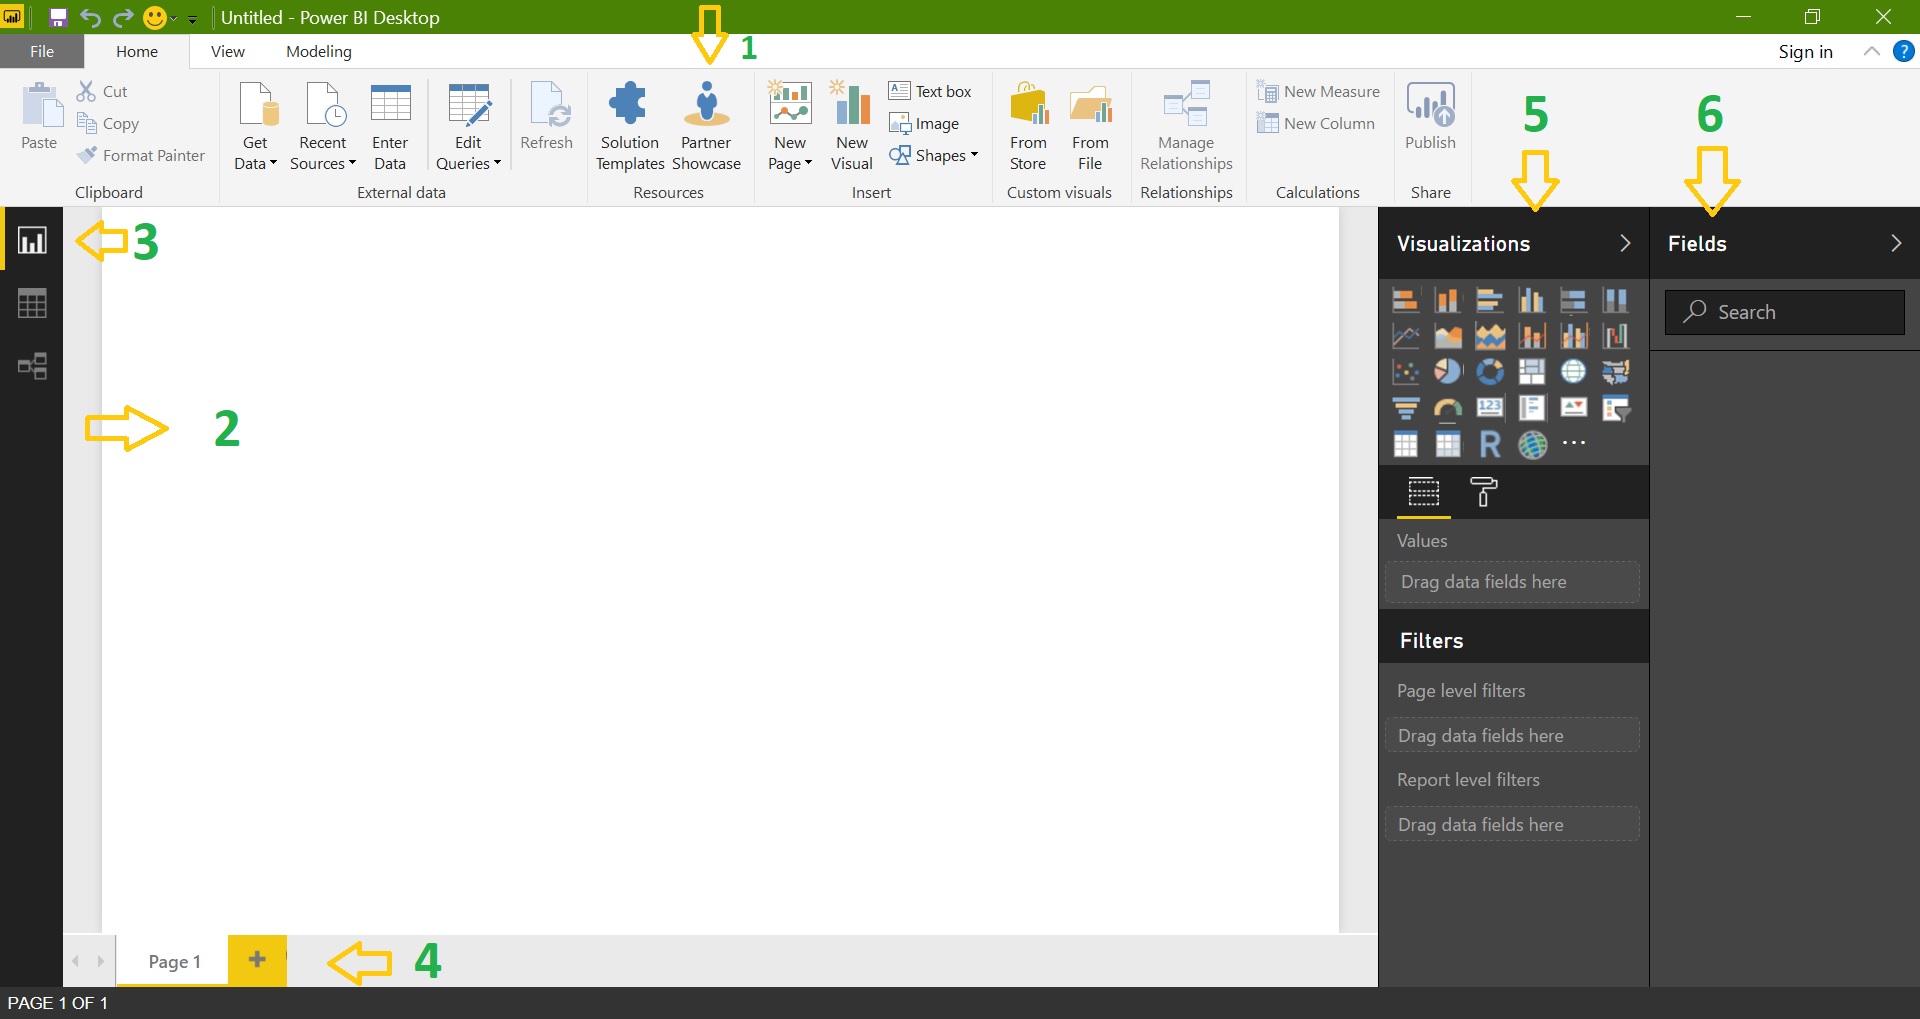
Power BI Desktop has 6 main areas:
Toolbar: It contains a set of tools which are used to get data, develop and publishing the reports
Report View / Canvas: Here we actually give life to data using various visualizations
Ribbon: Showcase the common tasks which are associated with the reports and visualizations
Pages: Allows us to add, remove pages in a report
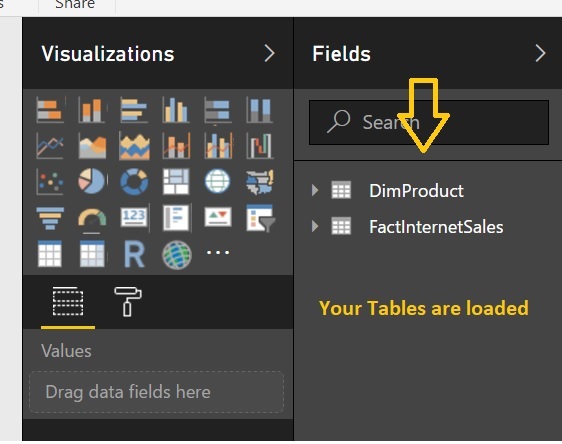
Visualizations: Where we can add, change visualizations, customize colors or axes, apply filters, drag fields etc.
Fields: Where query elements and filters can be dragged onto the Report view, or dragged to the Filters area of the Visualizations pane
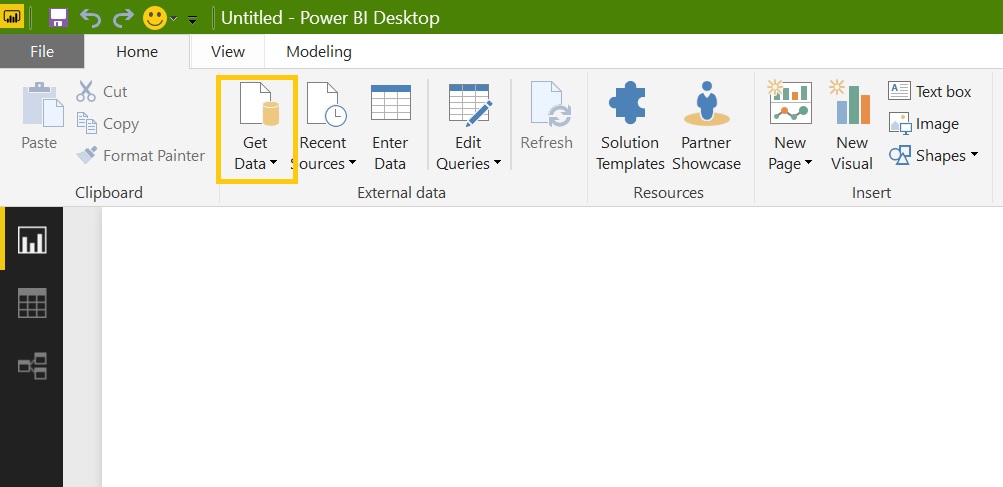
Getting Data into Power BI:
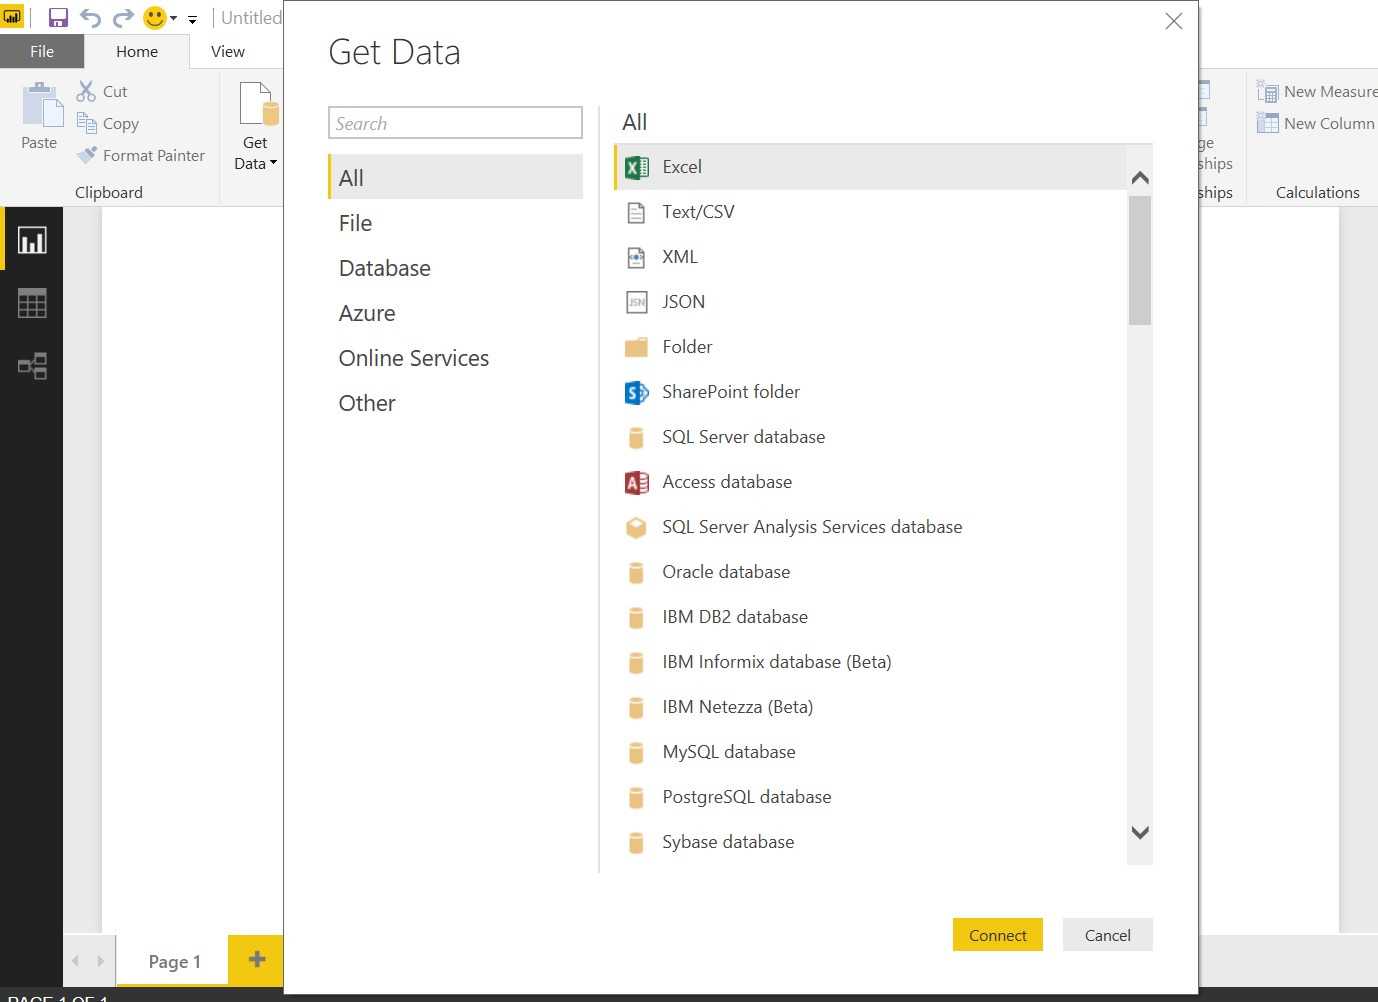
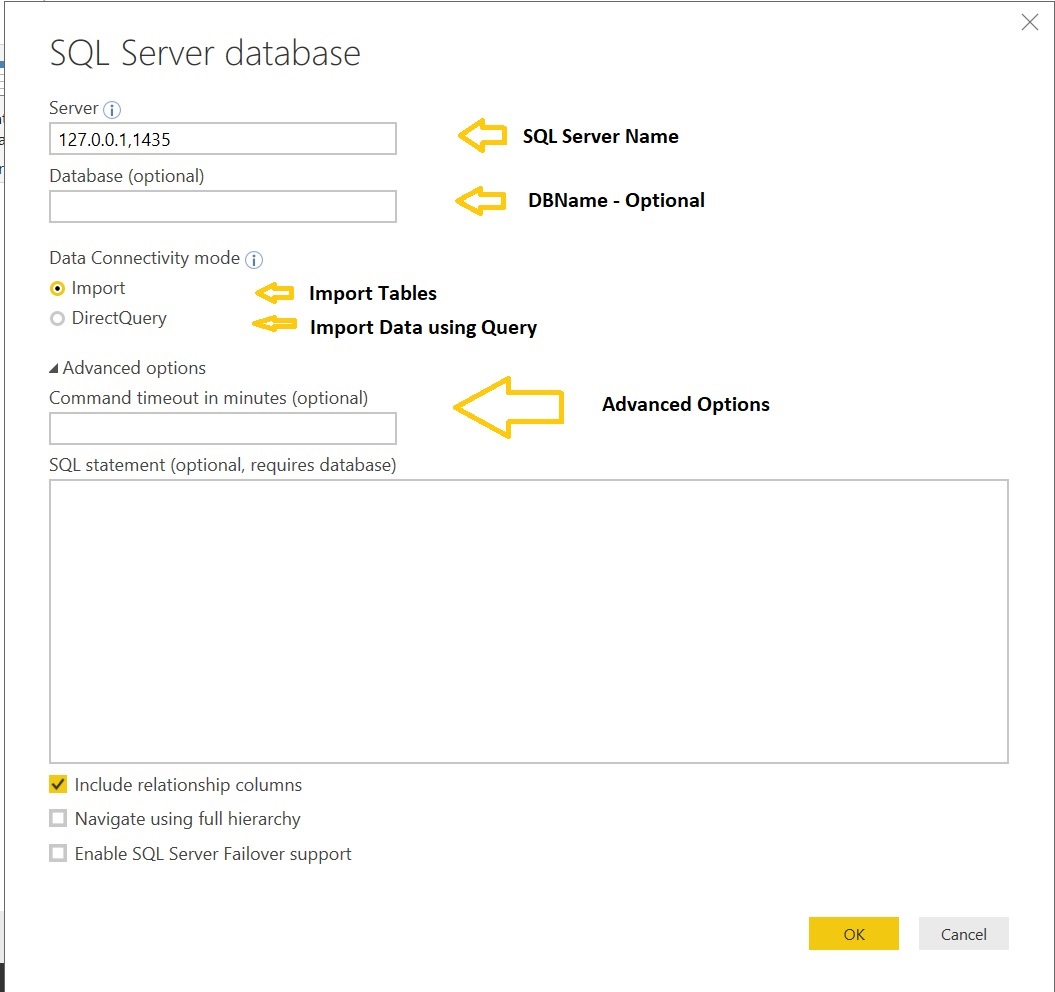
We’ll see how to load data from a source to Power BI Desktop. Power BI is a data centric application thereof we need to focus on providing the clean data as per the business requirement. Currently Power BI supports 70 + data sources and these are categorized into 5 types:
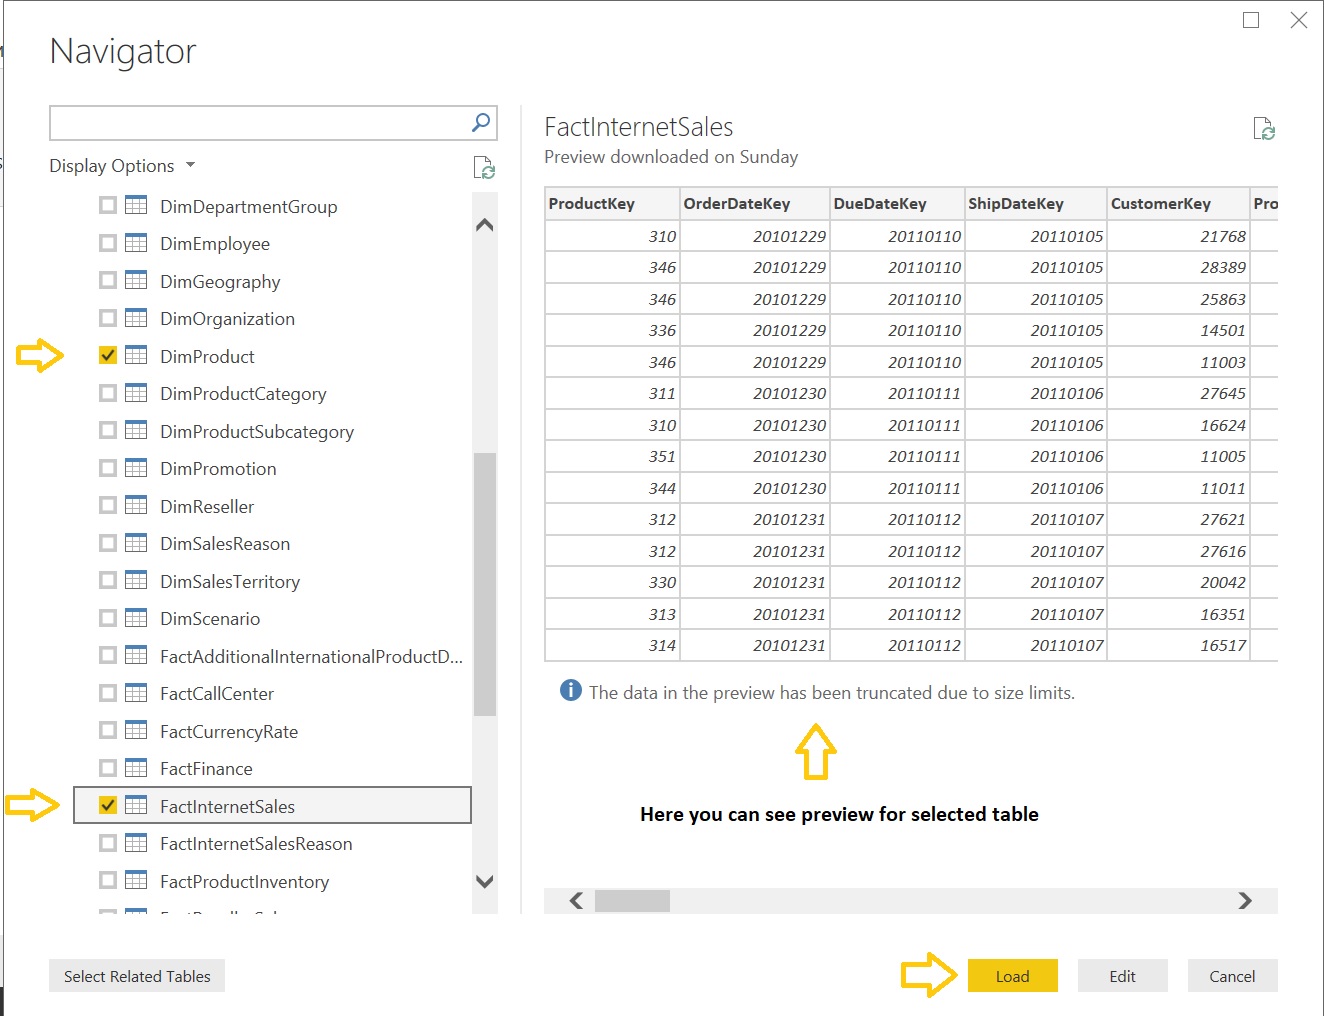
Now we have to select tables to import from SQL Server to Power BI. We’ll choose two tables from database [AdventureWorksDW2014]:
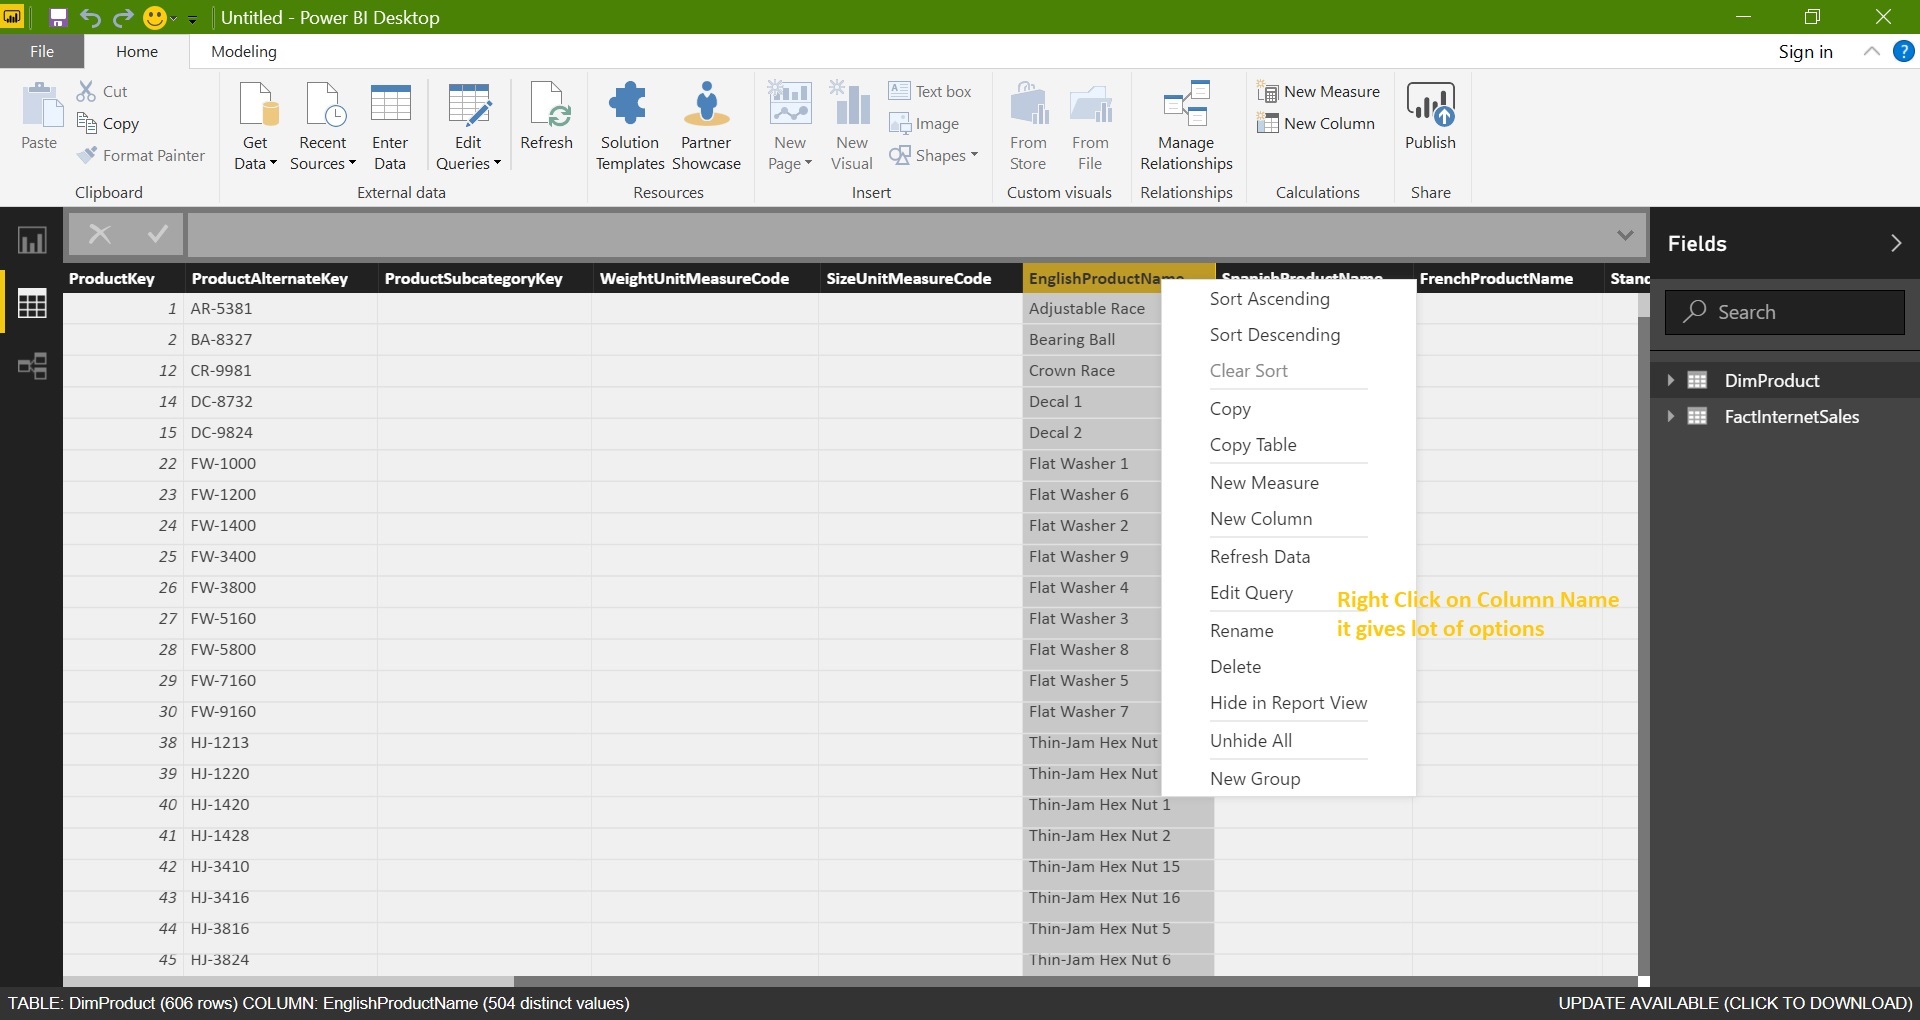
[DimProduct]: It stores product properties / metadata that might include name, color, height, weight, stock, price etc.
[FactInternetSales]: It stores product sales information that might include sale amount, tax amount, date info, discount info etc.
Note: If you are new to dimensions and facts don’t worry about it, just google it and see what is a FACT and Dimension. To simplify fact indicates numbers / measures and Dimension gives a meaning to fact using its properties / metadata. Ex: If I say 5 Cameras it’s just a measure which doesn’t have any meaning now if I say Mr.Chris has purchased 5 EOS cameras from Canada e-store on 14-Sep-17 gives a proper meaning. Here 5 is the FACT and dimensions are Customer (Chris), Product (Camera details), Country (Canada), Store (e-store) and Date.
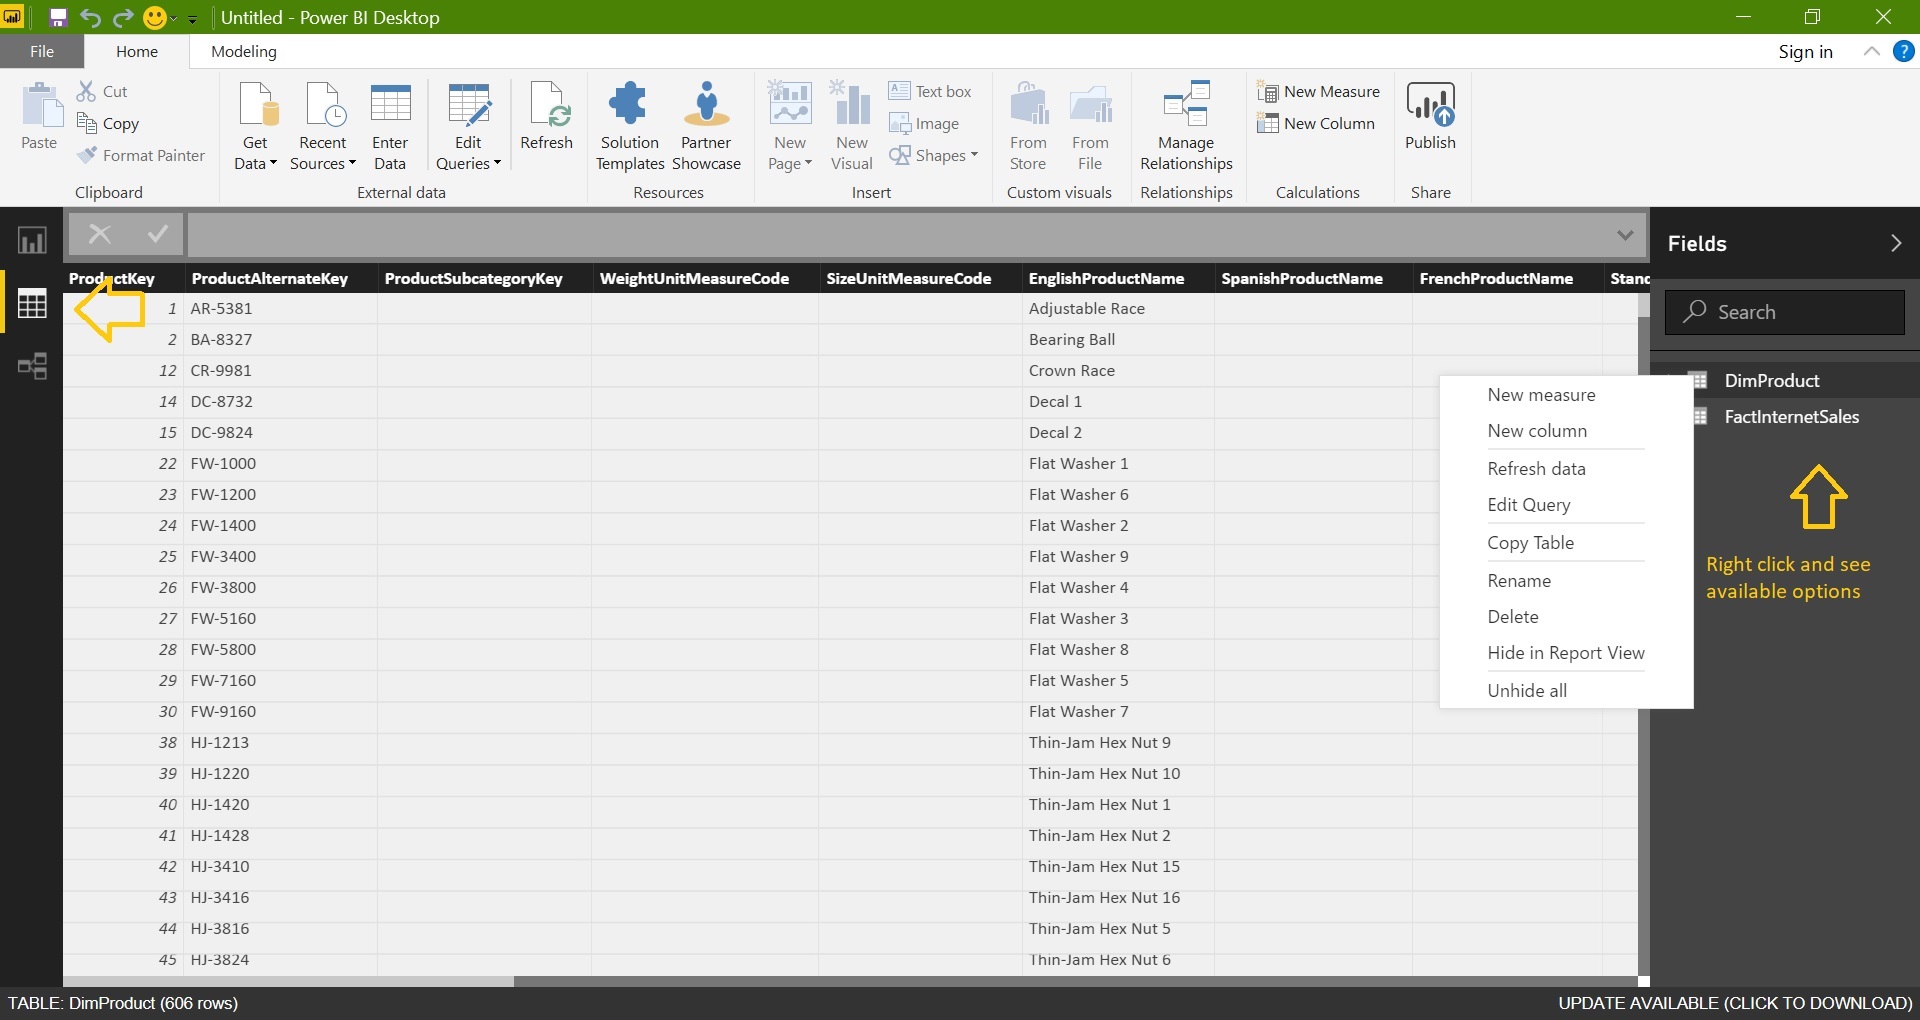
Import above tables into Power BI:
Just try to go with the flow, we are just exploring the Power BI desktop for the first time and not going to try all the options in one go.
Go back to the Report TAB and now we are going to design a simple report:
Let’s have a look at Visual (Clustered Column Chart) Properties:
We’ll use “Fields” and “Format” tabs and apply few customization:
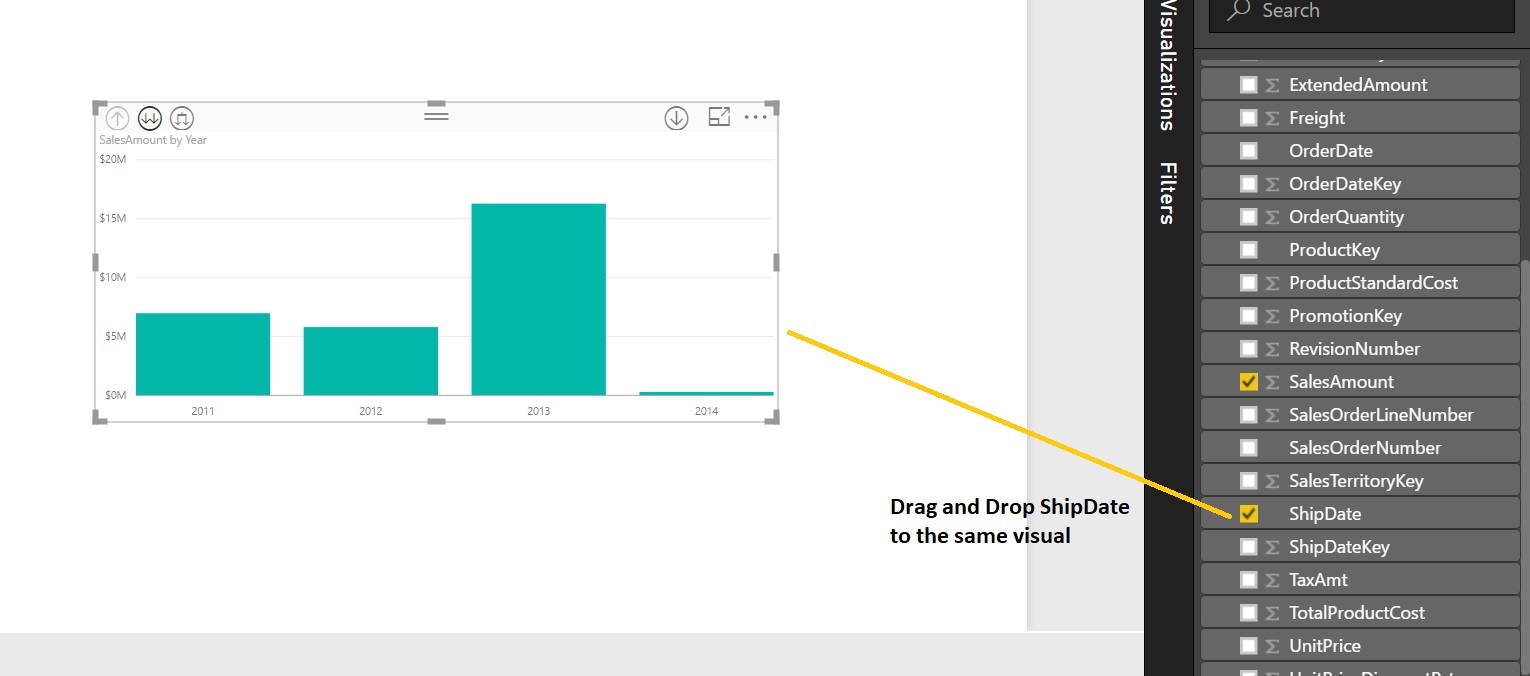
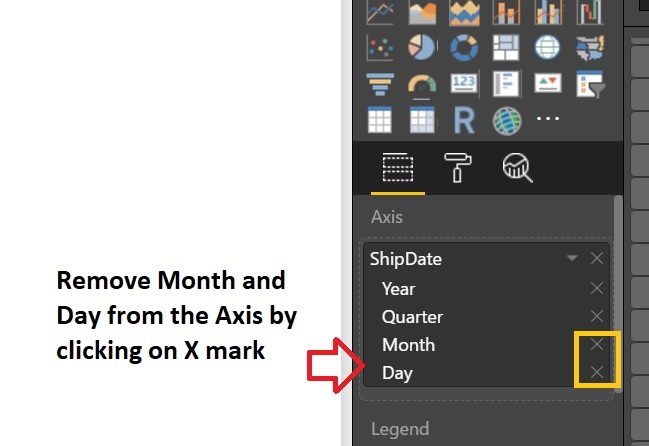
The chart is showing the Sales Amount based on the “ShippingDate”. It’s automatically groups data based on “Year”, “Quarter”, “Month” and “Day”. We’ll remove Month and Day as we just required Year and Quarter.
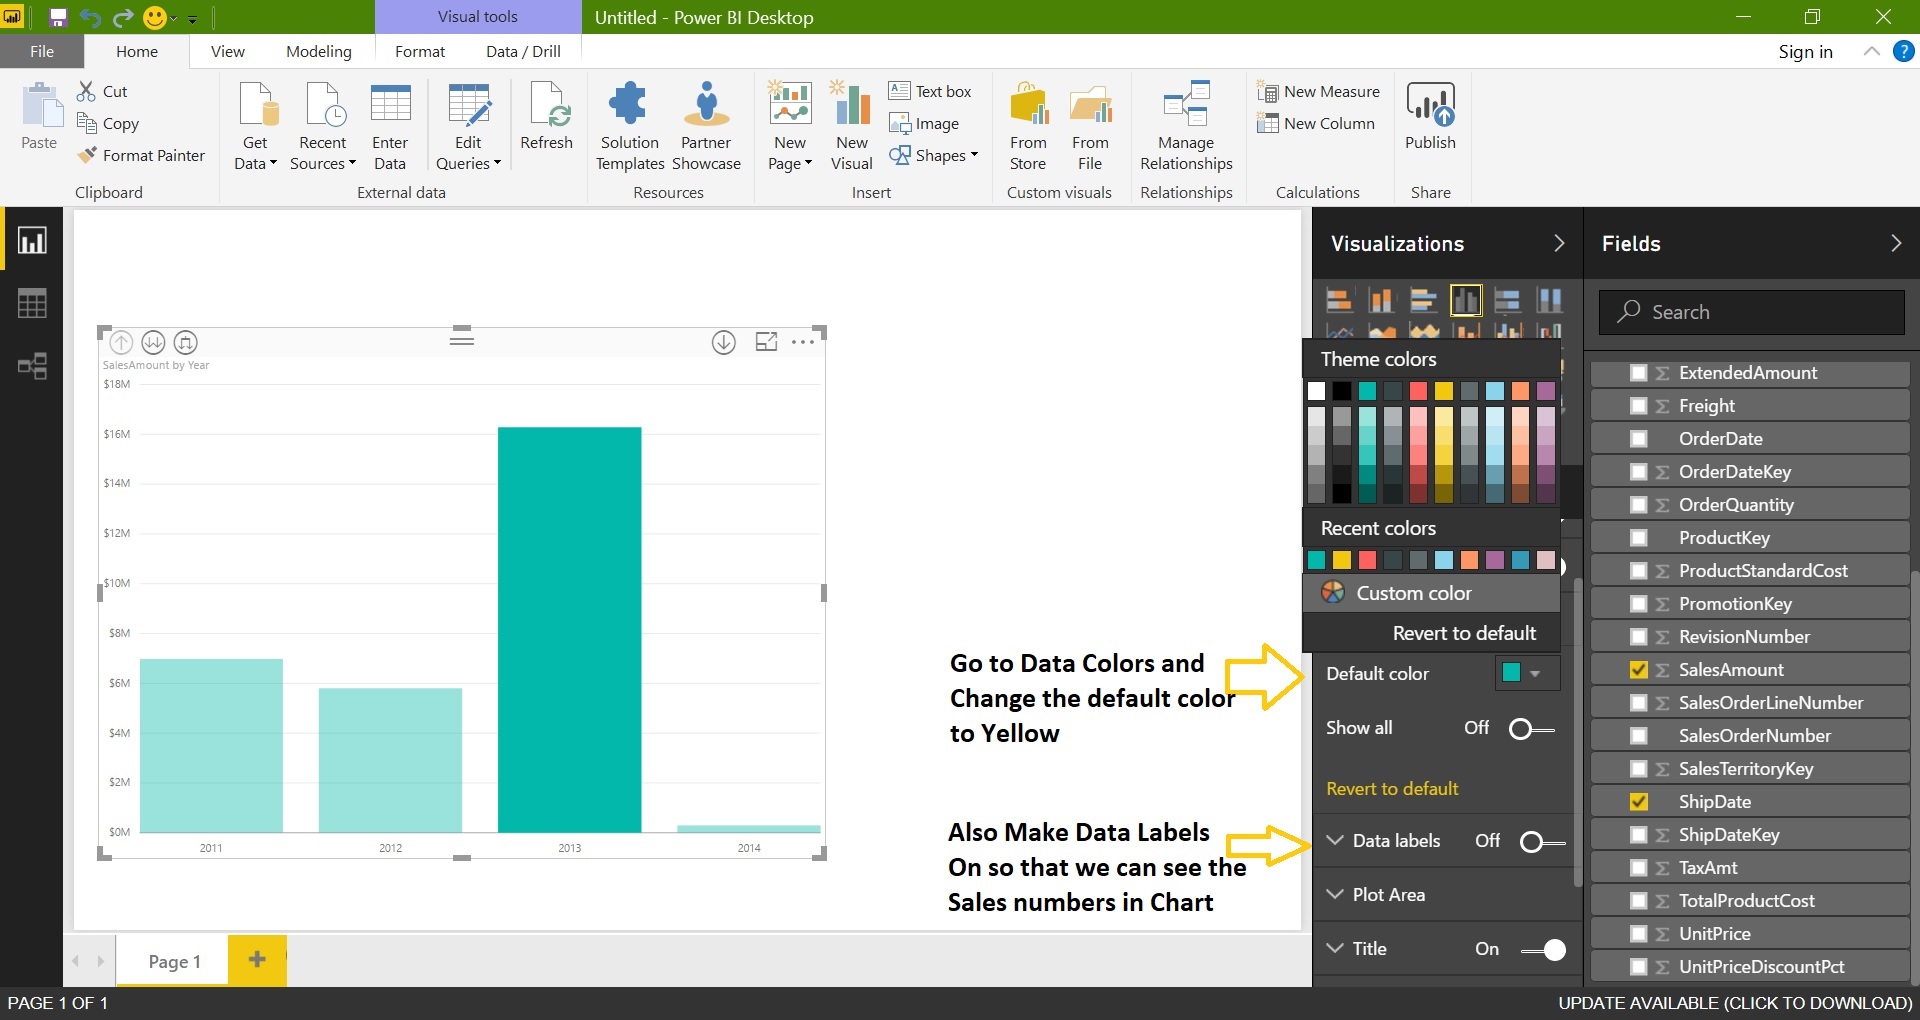
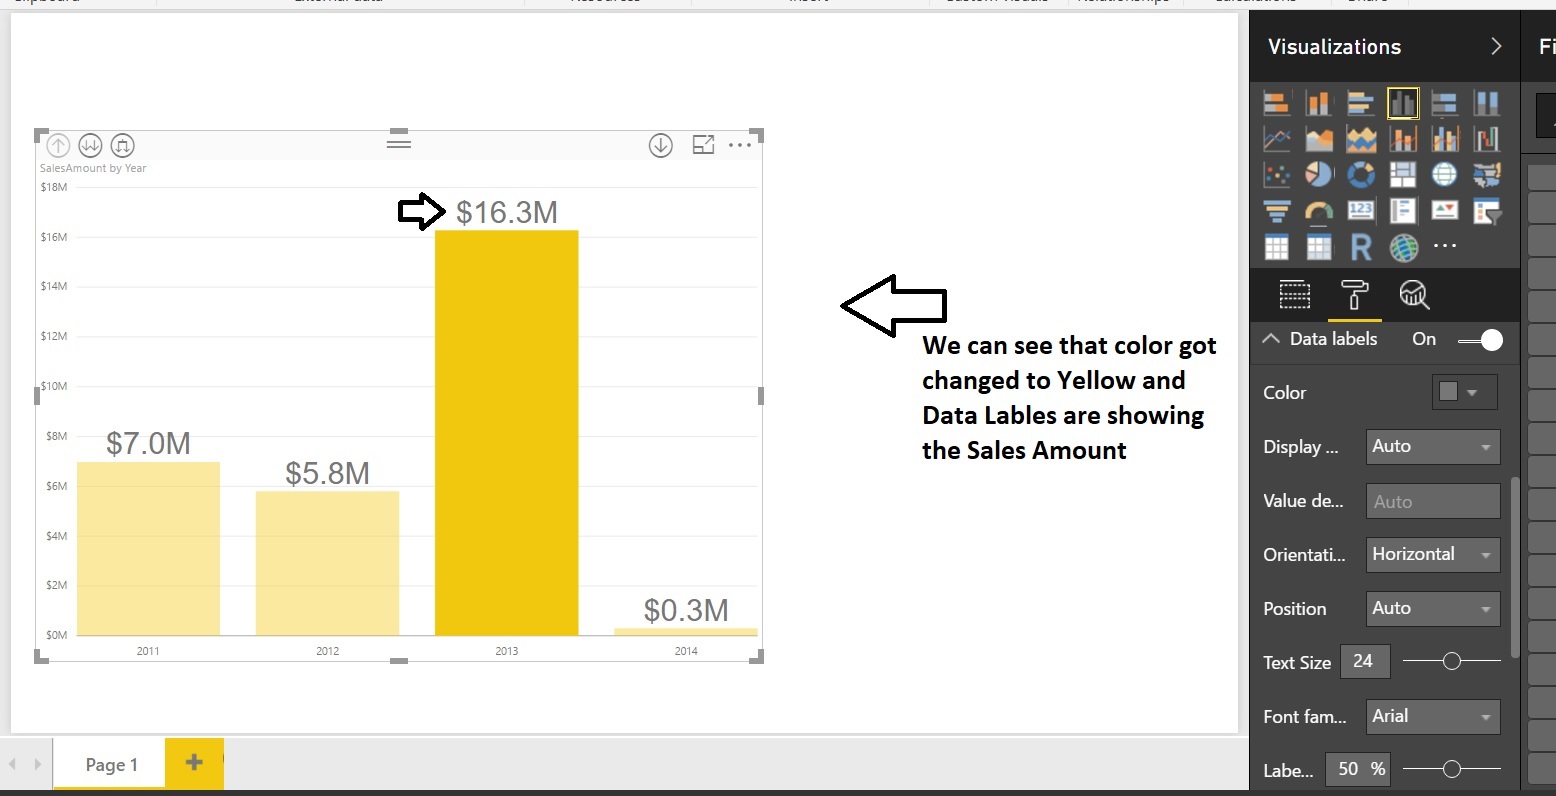
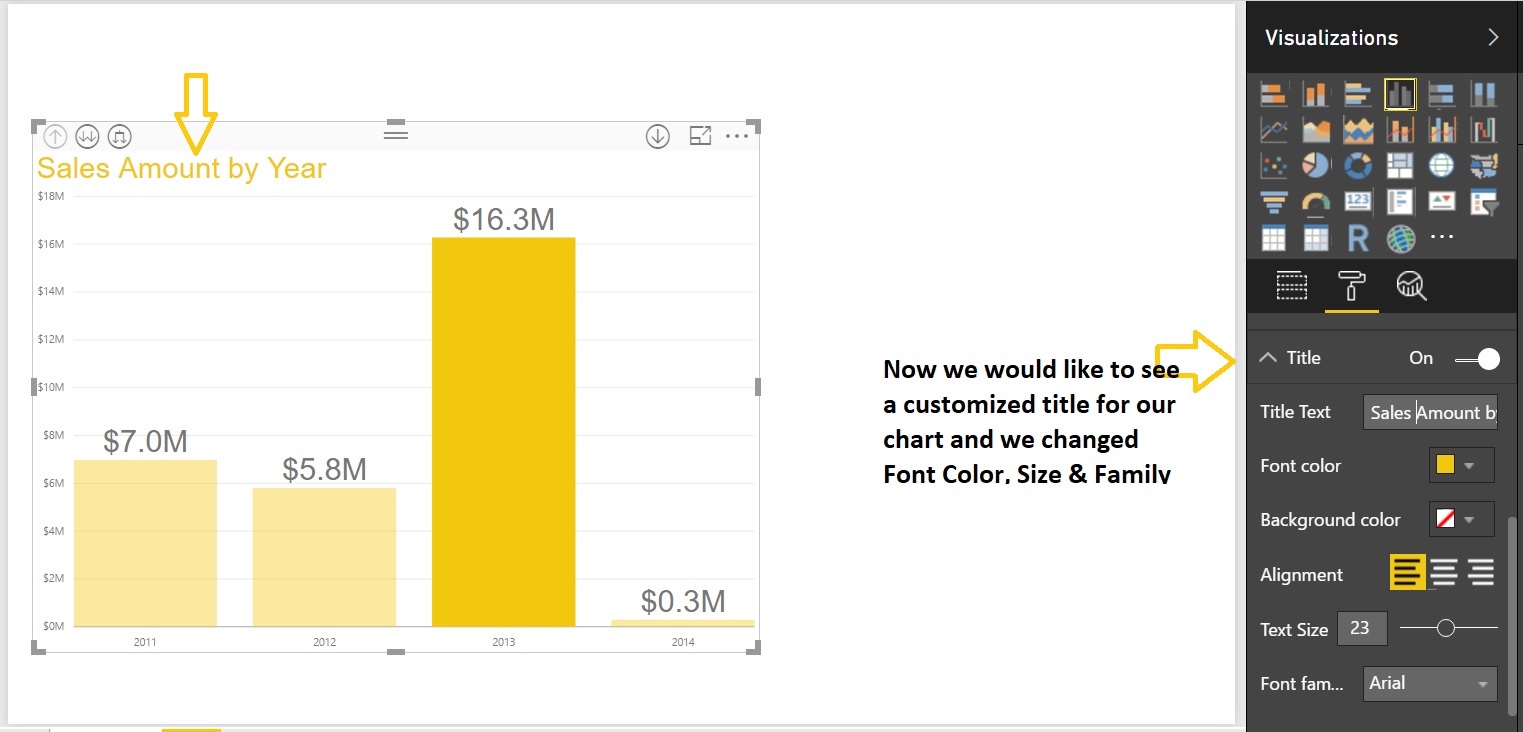
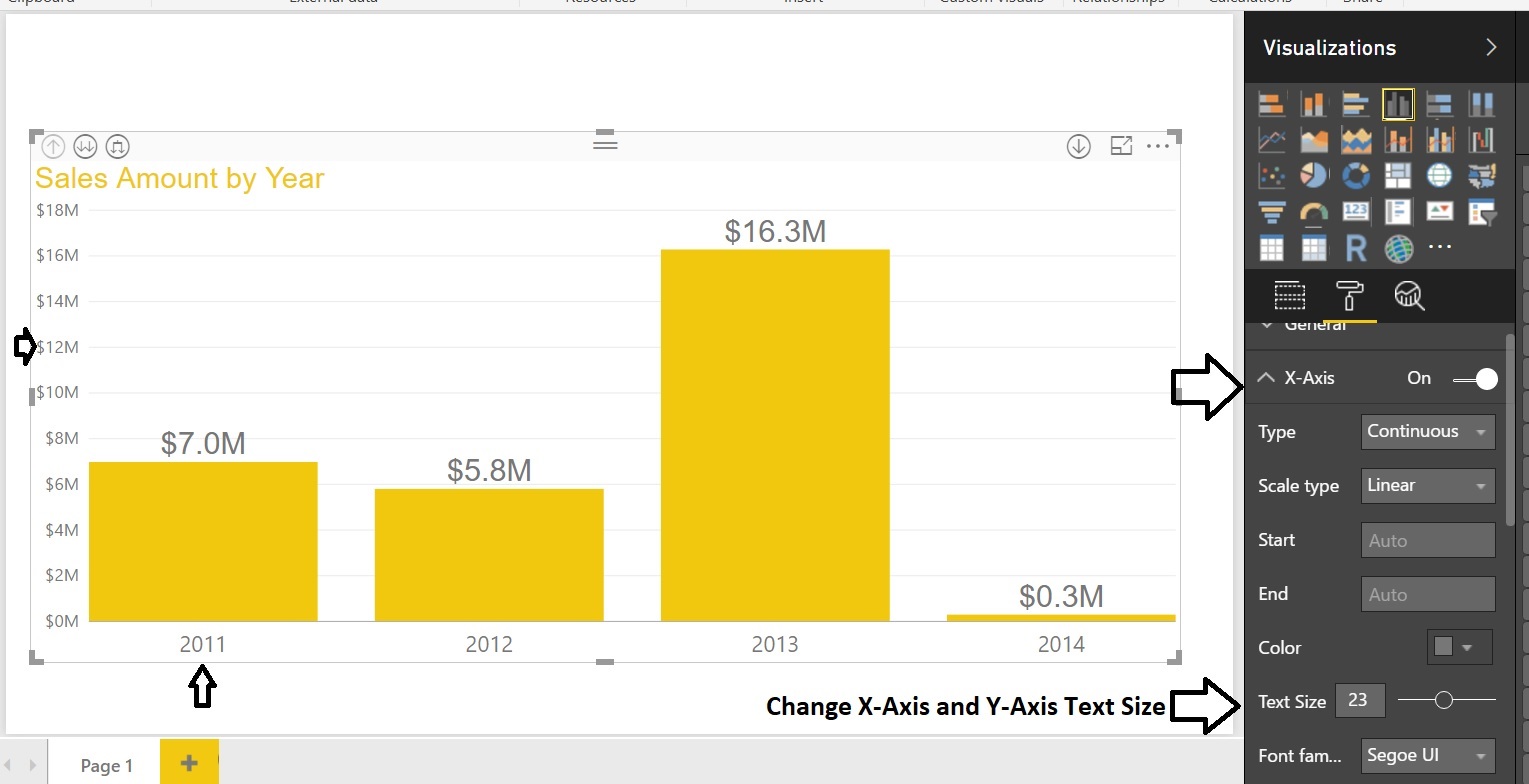
Now change the Chart data colors, Format the Chart Title, X-Axis, Y-Axis text size etc. Select the Chart and go to Format tab:
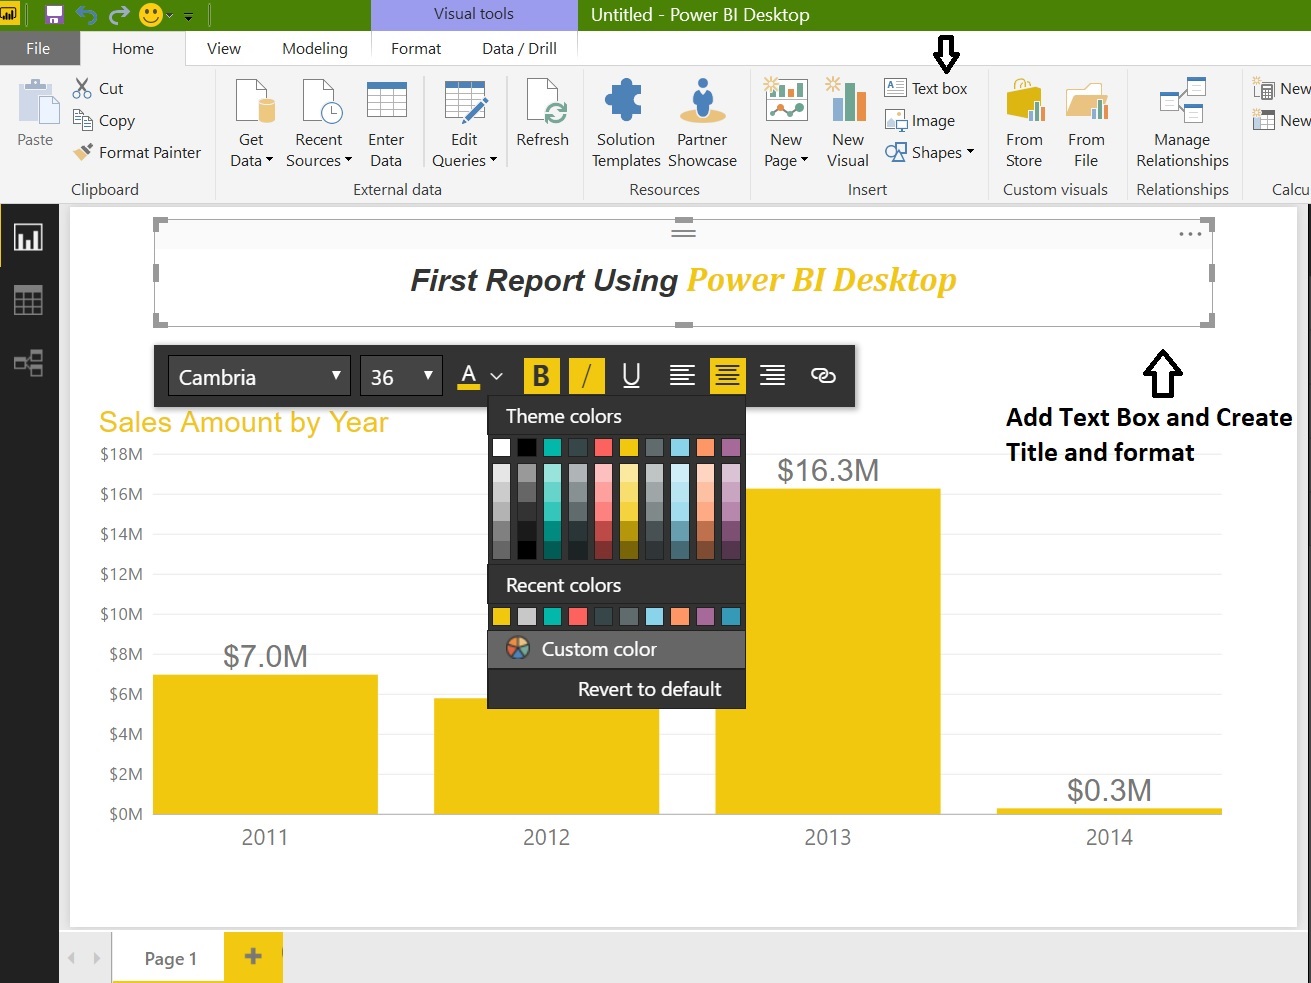
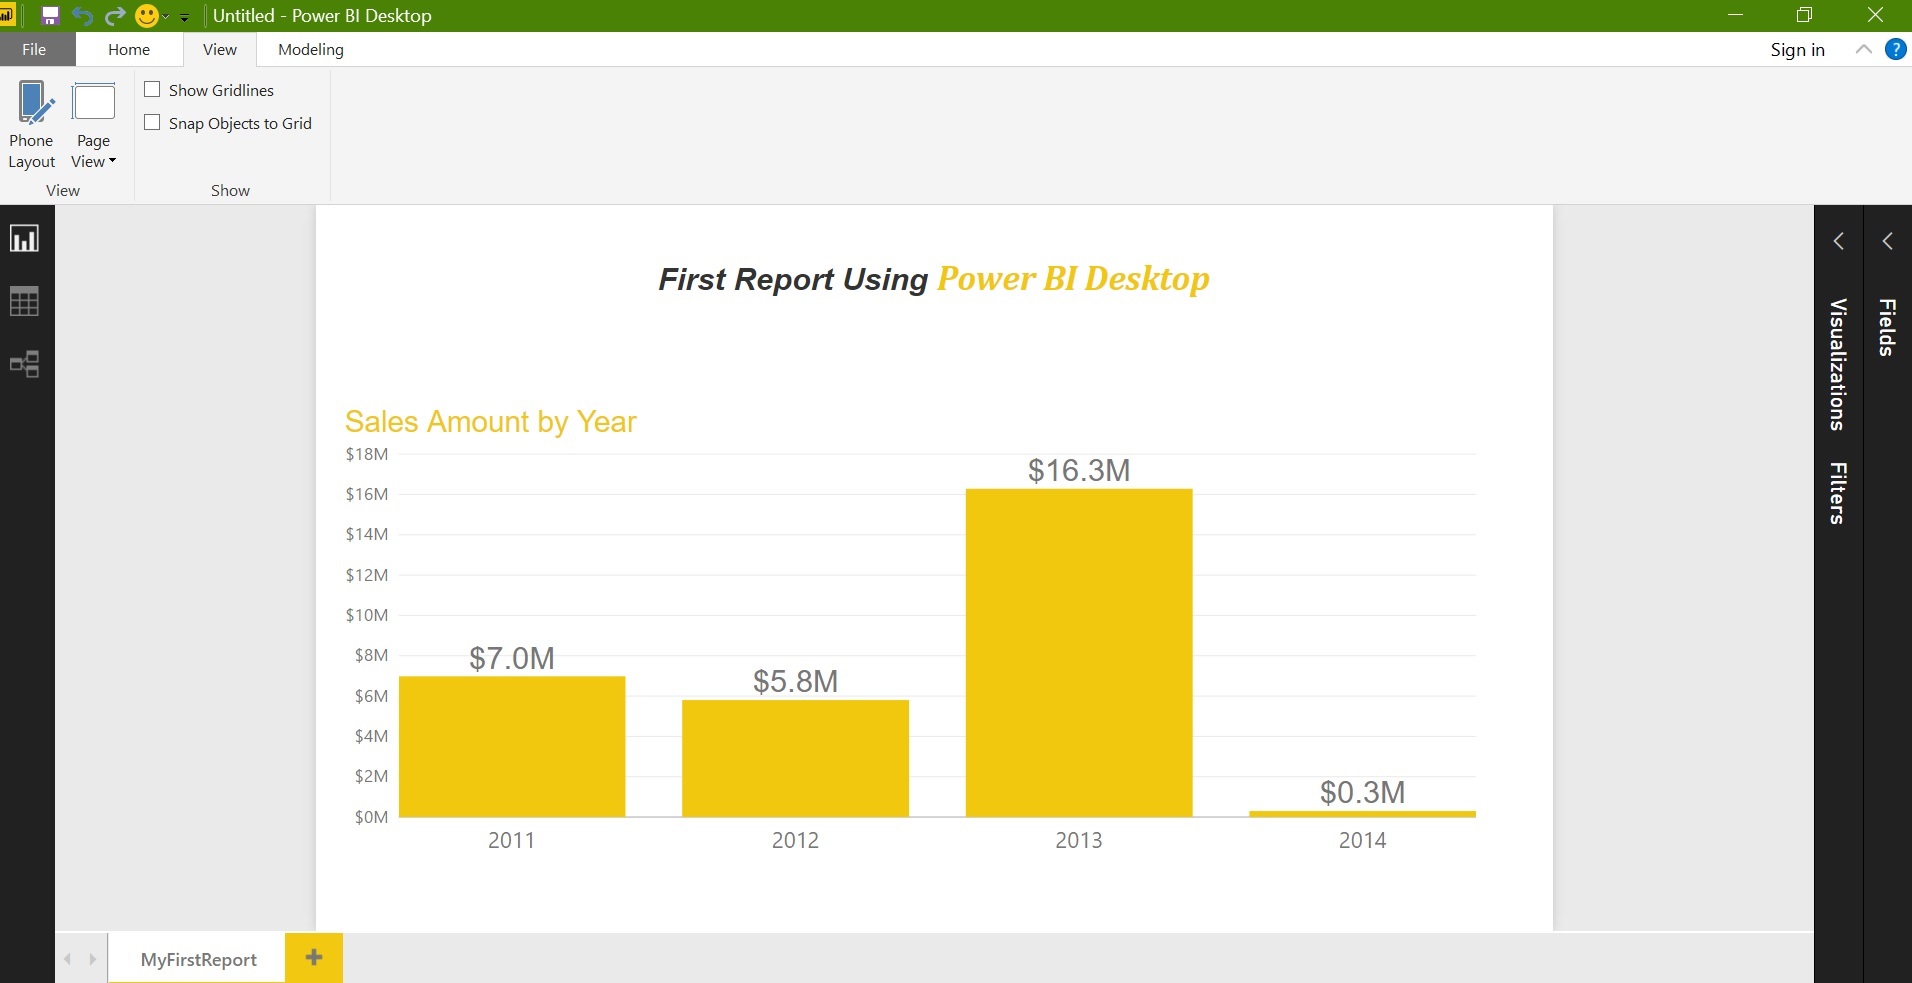
Finally add a Text box to the report also change the Page name to MyFirstReport:
Summary:
Started interacting with Power BI Desktop
Seen various parts of Power BI Desktop
Loading data from SQL Server to Power BI Desktop
Creating a simple report with a single visualization
Applied few formations to report
You can play with more options and get yourself free with the Power BI environment
In Next lesson we’ll start interacting with Power BI Cloud based Service
Hi uday arumilli, Amaze! I have been looking bing for hours because of this and i also in the end think it is in this article! Maybe I recommend you something helps me all the time? have created a Cache connection manager to store 20GB of data. My Physical memory on the server is 1.5TB and whey I run the package, it is failed at Cache connection with the following error Error: The system reports 12 percent memory load. There are 1649153396736 bytes of physical memory with 1446557532160 bytes free. There are 4294836224 bytes of virtual memory with 39915520 bytes… Read more »
Hi, Thanks a lot for your explanation which is really nice. I have read all your posts here. It is amazing!!!
Keeps the users interest in the website, and keep on sharing more, To know more about our service:
Please free to call us @ +91 9884412301 / 9600112302
Openstack course training in Chennai | best Openstack course in Chennai | best Openstack certification training in Chennai | Openstack certification course in Chennai | openstack training in chennai omr | openstack training in chennai velachery
Wow!! Really a nice Article. Thank you so much for your efforts. Definitely, it will be helpful for others. I would like to follow your blog. Share more like this. Thanks Again.
iot training in Chennai | Best iot Training Institute in Chennai
Thanks for such a great article here. I was searching for something like this for quite a long time and at last, I’ve found it on your blog. It was definitely interesting for me to read about their market situation nowadays.angularjs best training center in chennai | angularjs training in velachery | angularjs training in chennai | best angularjs training institute in chennai