Database Restore Progress in SQL Server

Database Restore Progress in SQL Server

This post will takes you through you monitoring Database Restore Progress in SQL Server. Here we have an useful script which can help us in the process of restoration of databases. As we are restoring the databases on daily basis of size ranging from 1 GB to 1TB files ,we would like to know the exact percentage completed , and estimated time to complete. The below script retrieves those details which can help us in further proceedings.

T-SQL Script to Monitor Database Restore Progress in SQL Server: 

USE MASTER
GO
SELECT
     Command,
     s.Text AS Query,
     start_time AS StartTime,
     percent_complete AS Percentage_Completed,
     CAST(((DATEDIFF(s,start_time,GetDate()))/3600)asvarchar)+' hour(s), '
          +CAST((DATEDIFF(s,start_time,GetDate())%3600)/60 asvarchar)+'min, '
          +CAST((DATEDIFF(s,start_time,GetDate())%60)asvarchar)+' sec'as Running_Time,
     CAST((estimated_completion_time/3600000)asvarchar)+' hour(s), '
          +CAST((estimated_completion_time %3600000)/60000 asvarchar)+'min, '
          +CAST((estimated_completion_time %60000)/1000 asvarchar)+' sec'as Est_Time_To_Go,
      DATEADD(second,estimated_completion_time/1000,getdate())as Est_Completion_Time
FROM  SYS.DM_EXEC_REQUESTS R
      CROSS APPLY sys.dm_exec_sql_text(r.sql_handle) s
WHERE
      R.Command in ('RESTORE DATABASE', 'BACKUP DATABASE', 'RESTORE LOG', 'BACKUP LOG')

We have initiated a restore and ran this query it shows the status as below

After a few minutes


Posted in Uncategorized | Tagged , , , , , , , , , | 1 Comment

Dynamic coloring for char series in SSRS

Dynamic coloring for char series in SSRS

This post helps in Dynamic coloring for char series in SSRS. We had a requirement to collect SQL Server job execution timings and showcase in a SSRS report using a bar chart. For the longest running times the bar should be colored with RED and the remaining all can be in green color.

Once you placed the Chart into your report. Go to the Chart and right click on any Bar

–> Select Series Properties –> Go to Fill Tab –> Click on Expression –> Place the below code

=IIf(Fields!RunDuration.Value>= Max(Fields!RunDuration.Value, “DataSet1”) And Min(Fields!RunDuration.Value, “DataSet1”)<> Max(Fields!RunDuration.Value, “DataSet1”) And Min(Fields!RunDuration.Value, “DataSet1”)>0, “Red”,”Green”)

**** Here RunDuration is the column name on which the series is being changed.

**** If the RunDuration of a job is same then all the bars in the series are shown as Green

Dynamic coloring for char series in SSRS

**** The highest execution bar is colored as Red…..

Dynamic coloring for char series in SSRS


Posted in MSBI, SSRS | Tagged , , | Leave a comment

How SQL Server Page Allocations Works

How SQL Server Page Allocations Works?

This post helps us in understanding “How SQL Server Page Allocations Works”. When I drop an object SQL Server does not immediately re-use those extents for a new object. This is because the storage engine is optimized for speed to continue allocating new extents from available free space in the file rather than always going back in to routines to identify and reclaim previously dropped extents.

 The storage engine maintains a pointer in the FCB for each file to point to the next available (uniform or mixed extent).  It continues to move this pointer along the file as objects and extents are allocated.  The storage engine does not constantly evaluate to move this pointer back to previously dropped extents  until it reaches the end of the file and is faced with an auto-grow or out of space.  Then routines will kick in to aggressively start going back through the file to reclaim available extents.  The reason why the storage engine does the allocations this way is primarily for speed and performance.  If the storage engine was always trying to go back through the file to look for previously available extents then allocation of new extents would be much slower and fragmented rather than continuing along the available space in the file.  The storage engine will only get aggressive to reclaim space when it has no other alternative and space at the end of the file is not sufficient and then go back through to see where it can find space to handle the new allocations.

 As an example, say my database file looks like the following with free available extents at the end of the file and my FCB points to extent 101 as the next available uniform extent: Now we will see how SQL Server Page Allocations Works.

How SQL Server Page Allocations Works

I then create a new table and insert some data.  The storage engine allocated extents 101-103 for my new data.  The FCB pointer was moved along and now points to extent 104 as the next available uniform extent:

How SQL Server Page Allocations Works

 Then I do what I needed to do with that object data and decide to drop the object.  Extents 101-103 are no longer in use (there are other cleanup routines that go through and mark extents as available).  Note that the FCB pointer continues to point to extent 104 as the next available uniform extent:

How SQL Server Page Allocations Works

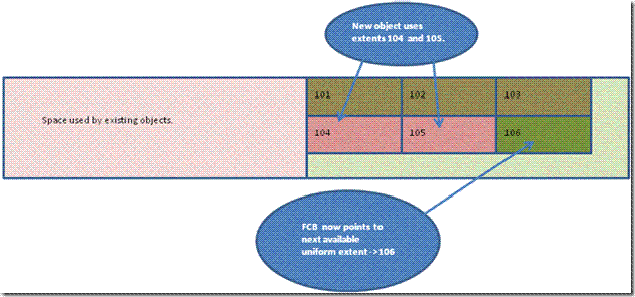
I then decide to create another table and insert some data.  The storage engine looks at the pointer for the next uniform extent and starts allocation for my new object at extent 104.  Extents 105 and 105 are allocated for my new object and the FCB next available uniform extent pointer is moved along to 106:

How SQL Server Page Allocations Works

Posted in SQL Development, SQL Server DBA | Tagged , , , , | Leave a comment