Report Overview
SQL Server Health Check HTML Report is the improved version of the old report and it can help you to quickly monitor the health of a given SQL Server instance. This report fetches and process the data from system tables and dynamic management views. It reports the crucial factors that showcase the current database instance performance. It’s been written using T-SQL script. We can run it on any SQL Server instance starting from 2008 R2 to 2019. Save the result as .HTML format and the same can be viewed through any web browser. We neither tested it on Azure nor RDS instances, thereof we may need to do some code changes for cloud instances. Script download is available at the end of this post.
Report Parts
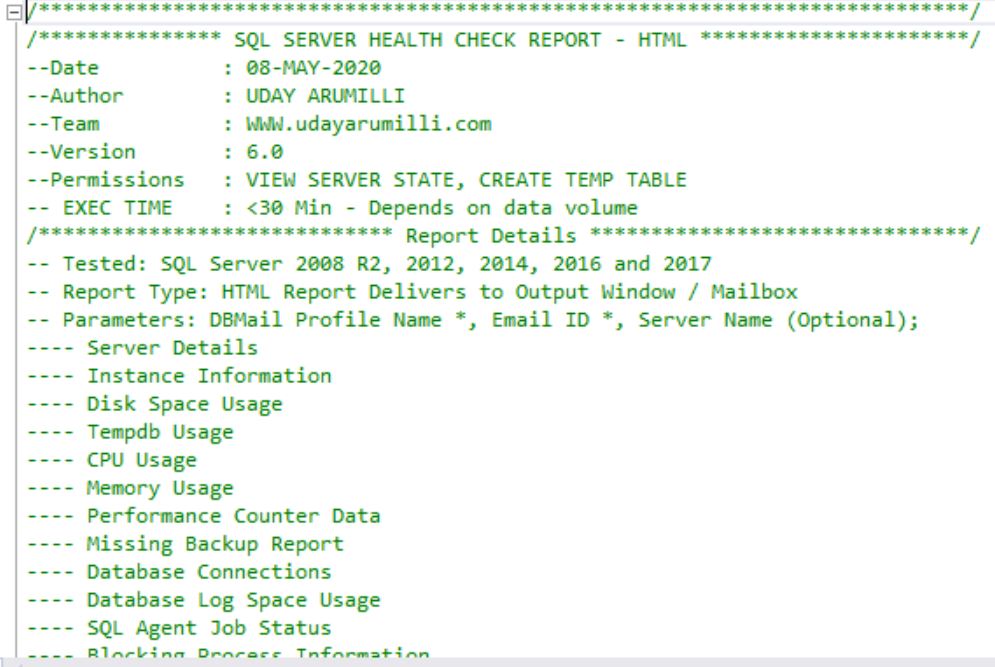
Report contains below parts:
- SERVER DETAILS
- INSTANCE INFORMATION
- DISK SPACE USAGE
- TEMPDB USAGE
- CPU USAGE
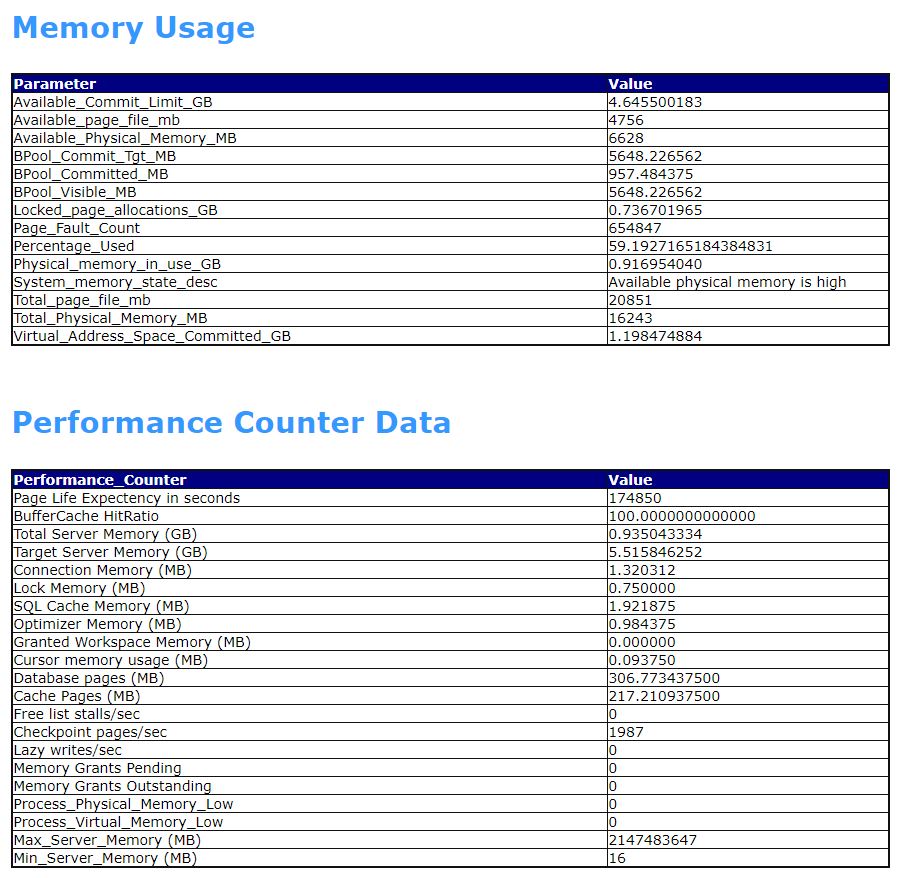
- MEMORY USAGE
- PERFORMANCE COUNTER DATA
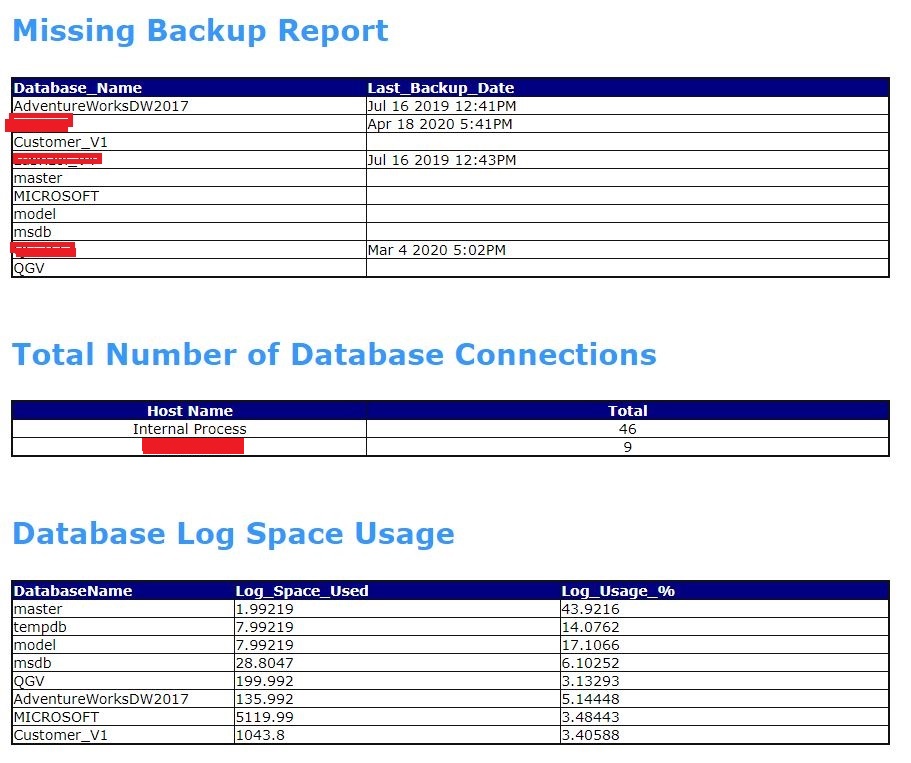
- MISSING BACKUP REPORT
- DATABASE CONNECTIONS
- DATABASE LOG SPACE USAGE
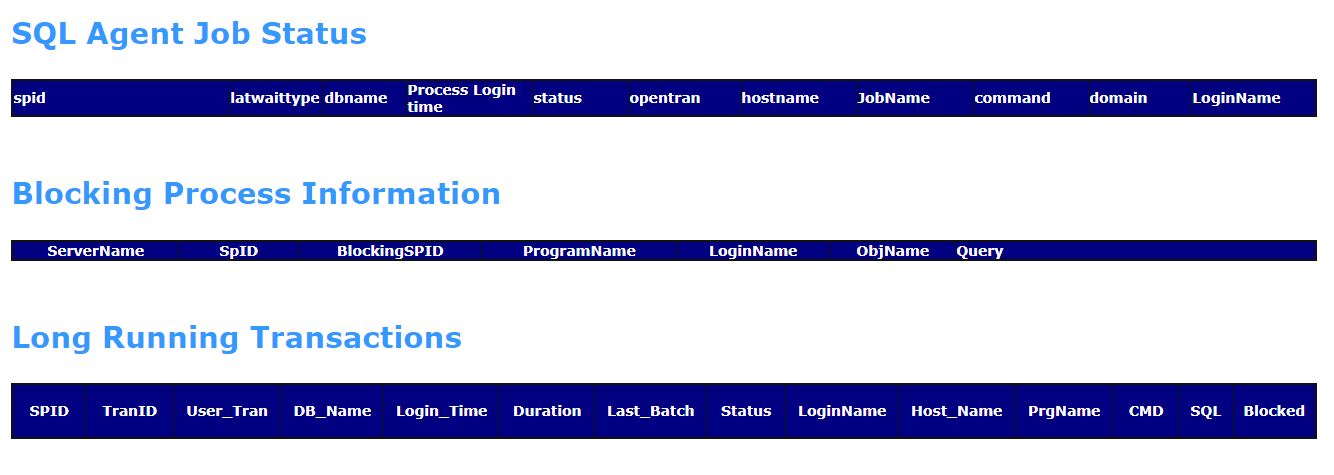
- SQL AGENT JOB STATUS
- BLOCKING PROCESS INFORMATION
- LONG RUNNING TRANSACTIONS
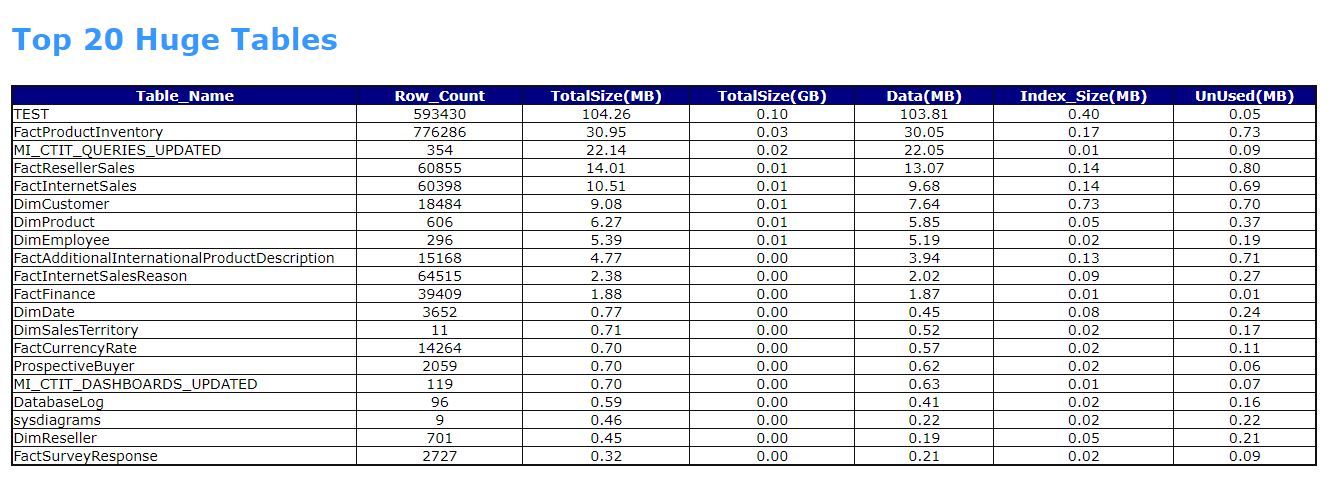
- TOP 20 TABLES
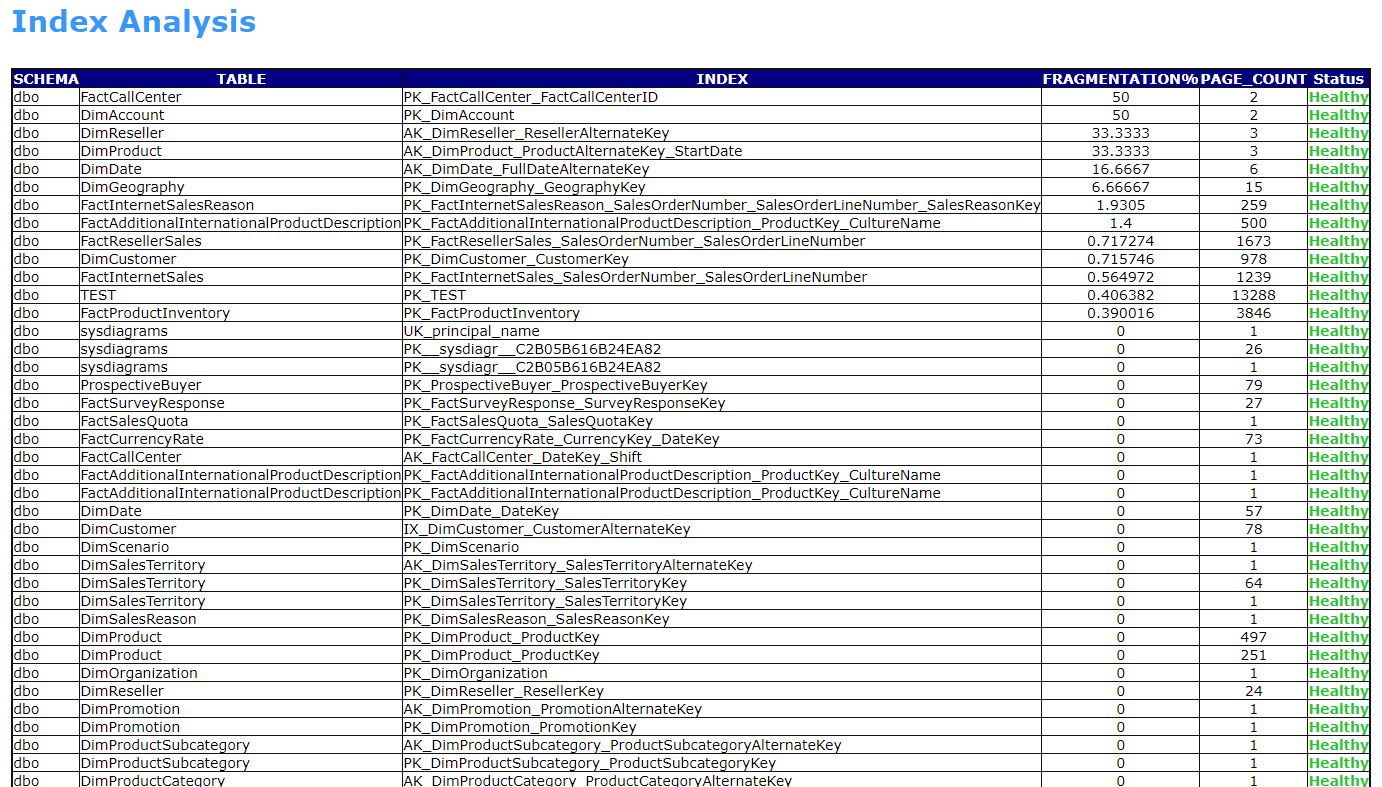
- INDEX ANALYSIS
- SQL ERRORLOG
Execution Procedure
- Create the stored procedure “[usp_SQLhealthcheck_report]”
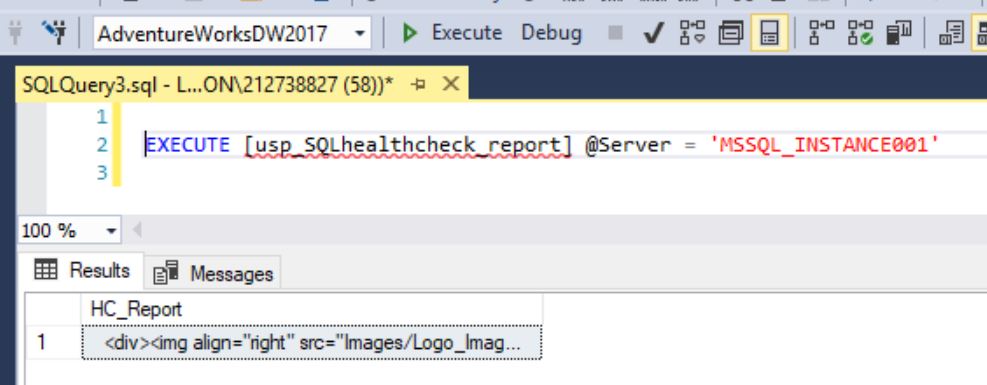
- Execute the procedure Ex: EXECUTE [usp_SQLhealthcheck_report];
- Pass Mail profile and Email details @MailProfile, @MailID. Not mandatory
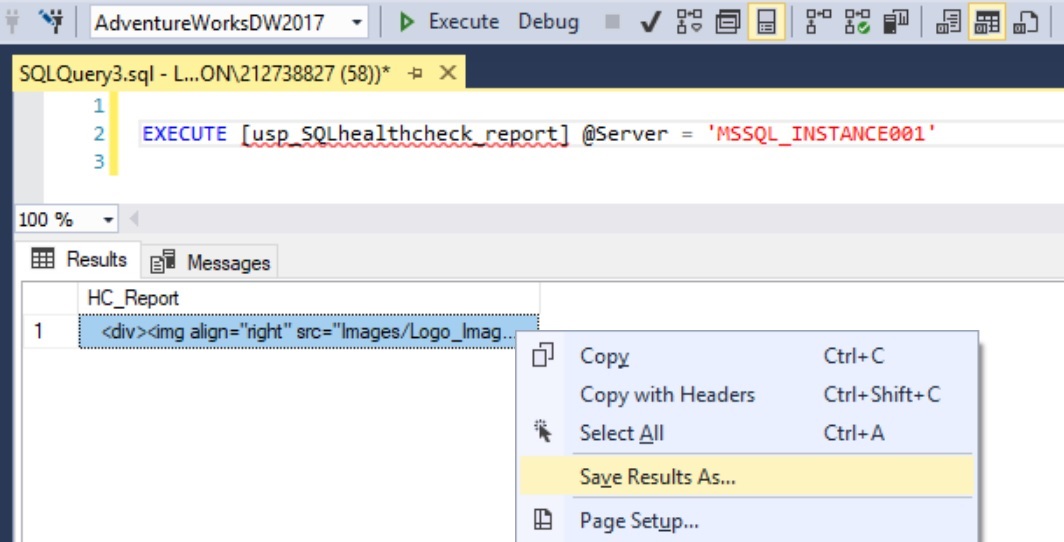
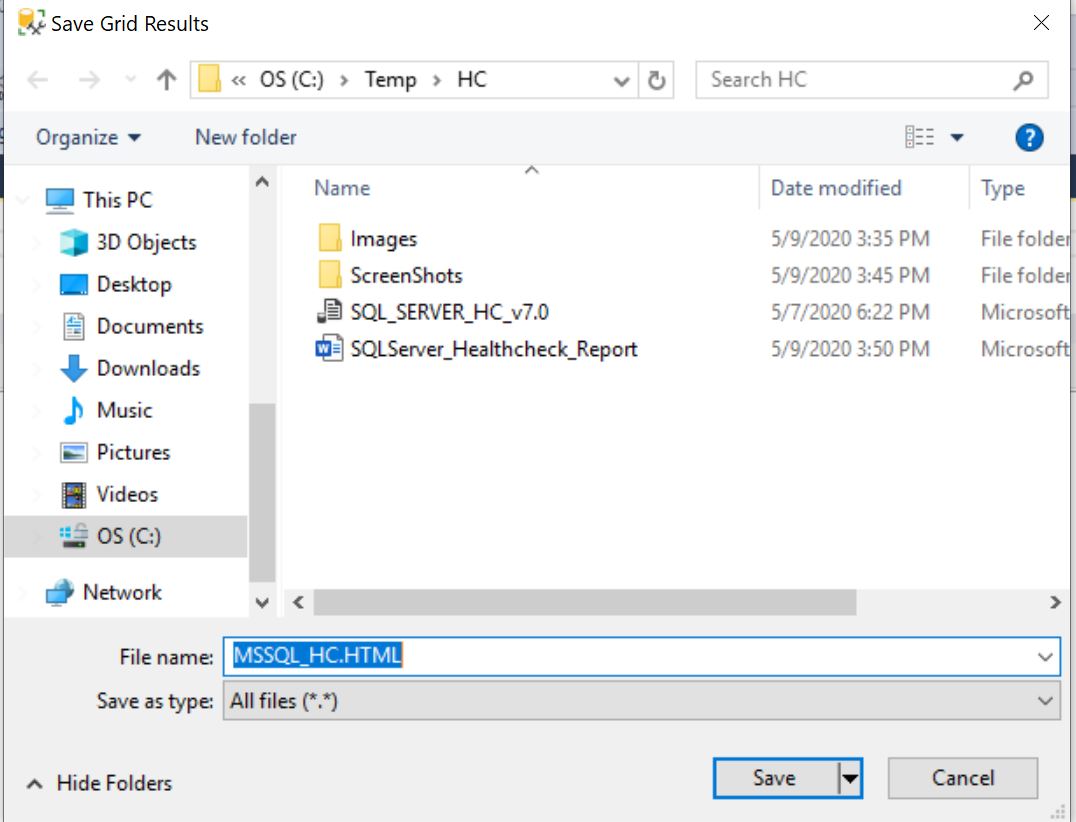
- Save Result As: Save output as .HTML on your local
- Make sure that the saved report is on the same folder where Images folder exists. So that we can see the LOGO at right corner.
Output Format
- Direct HTML report
- Send email with HTML as an attachment
Critical Performance Counter Data
This section captures the critical performance counters from management views. Some of those counters plays the vital role in system performance evaluation.
Page Life Expectancy (PLE): How many seconds a page is being available in Memory.
Buffer Cache Hit Ratio (BHR): What is the percentage of database calls reaching Buffer Cache instead of Disk storage.
Grants Pending: If any Memory requests pending from OS
Memory Low Alerts: 0 indicates no such alerts registered.
Recommendation for Continues Monitoring
If we want to design performance trends, then I would recommend the below parameters for monitoring on continues basis:
CPU Usage
- SQL Process Utilization
- System Idle
Memory Usage
- Total_Physical_Memory_MB
- Physical_memory_in_use_GB
Performance Counter Data
- Page Life Expectancy
- Buffer Cache Hit Ratio
- Memory Grants Pending
- Memory Grants Outstanding
- Process_Physical_Memory_Low
- Process_Virtual_Memory_Low
Blocking Process Information
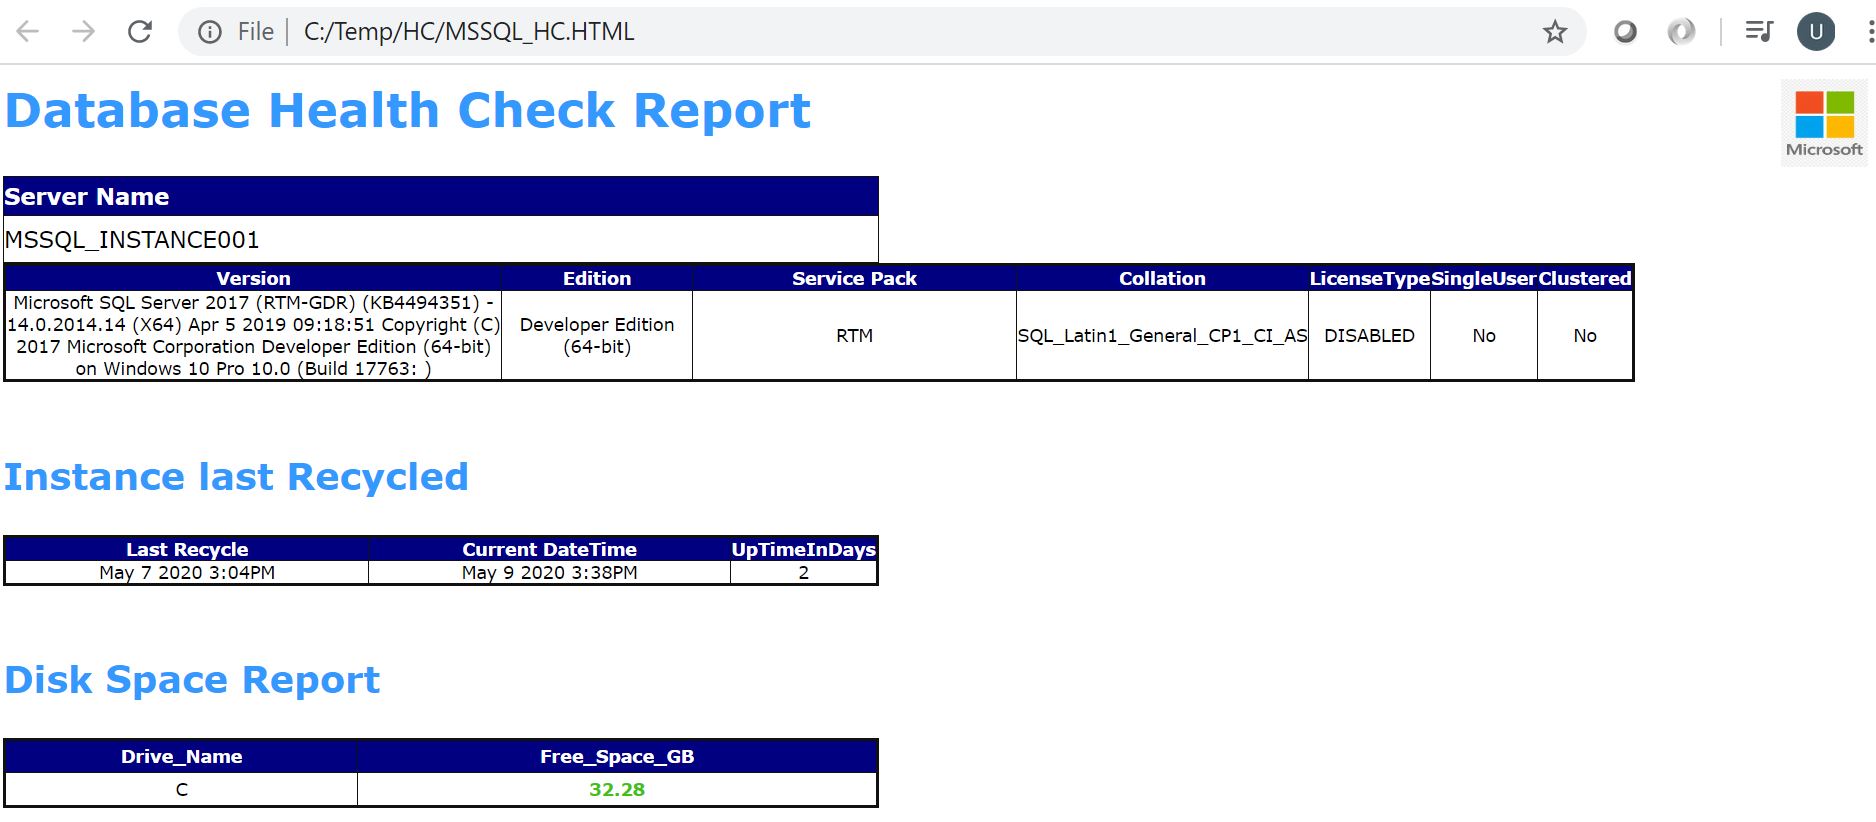
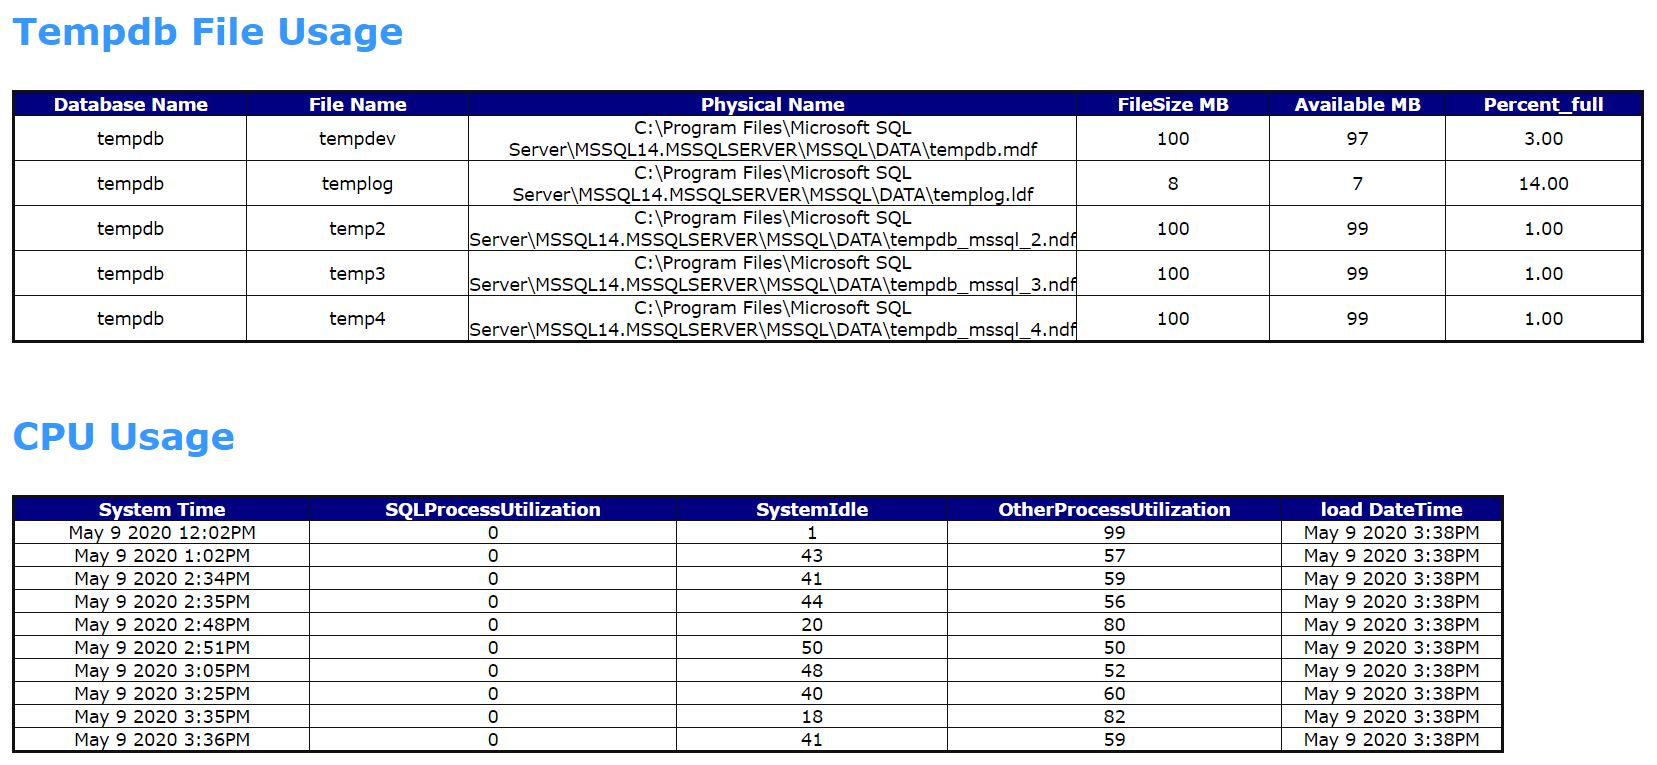
Sample Screenshots from HTML Report:
Create procedure on the required database:
Execute the procedure. I don’t need to send email rather just need a HTML report
Create Images folder and create the required company logo and name it as Logo_Image.jpg
Open the report in a web browser, Sample Screenshots
Summary:
SQL Server Health Check HTML Report is useful to quickly get the performance snapshot of a database instance. After going through the overall system parameters, except the minor issues we can clearly state that the both instances are optimally performing. Index maintenance and the database log file maintenance are the critical activities to be considered. Please make note that the HC report tool is not reporting the SQL code issues and its scope is restricted to the database system level performance.
Note:
- Always test the script on Pre-Production environment
- Top 20 Tables may take some time for VLDB
- You can customize the script based on requirement

