How SQL Server Optimizer Calculates the Estimated Row Count
This post can help you out in understanding “How SQL Server Optimizer Calculates the Estimated Row Count”. Once query is submitted, query optimizer takes the help from Histogram (Cardinality Estimates) statistics and builds the execution plan. Now we’ll see how histogram helps optimizer to get the estimated row count. Histogram contains 5 columns:
RANGE_HI_Key: Top data distributed values based on index or previous executed search conditions.
RANGE_Rows: When optimizer can’t find the exact match but nearby values. It captures the number of rows between the given nearby values.
EQ_ROWS: Number of rows exactly matching the search condition.
DISTINCT_Range_Rows: When optimizer can’t find the exact match but nearby values. It captures the number of distinct rows between the given nearby values.
AVG_RANGE_ROWS: When optimizer can’t find the exact match it still gets the estimated row count by using the formula: [Range_Rows]/[Distinct_Range_Rows]
Create a Table and Insert Data:
--Create a new table

CREATE TABLE Sales_Test (

OrderID INT IDENTITY(1,1) NOT NULL,

ProductID SMALLINT NOT NULL,

OrderQty SMALLINT NOT NULL,

UnitPrice MONEY NOT NULL)

--Create a clustered index on OrderID

CREATE CLUSTERED INDEX CL_IX_OrderID ON Sales_Test(OrderID);

--Create a Non-Clustered index on ProductID

CREATE NONCLUSTERED INDEX NON_CL_IX_ProductID ON Sales_Test(ProductID);

-- Insert Data from the table AdventureWorks2014.SALES.SalesOrderDetail

INSERT INTO Sales_Test

SELECT ProductID, OrderQty, UnitPrice

FROM SALES.SalesOrderDetail

GO 5
View Histogram:
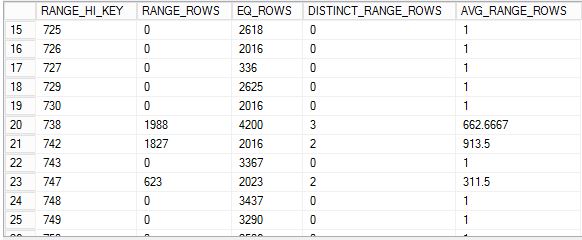
We can check the cardinality estimates using DBCC SHOW_STATISTICS:
DBCC SHOW_STATISTICS ('Sales_Test','NON_CL_IX_ProductID') WITH HISTOGRAM;
Above cardinality estimates shows how data has been distributed for the various “ProductID’s”. Now we’ll take an example and see how estimated row counts are calculated.
Example 1
SELECT * FROM Sales_Test WHERE ProductID = 730;
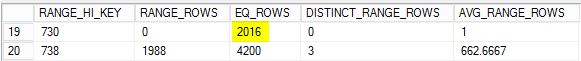
From the statistics we can seek for ProductID = 730. When ProductID = 730 EQ_Rows: 2016; that means there are exactly 2016 rows available with ProductID = 730;
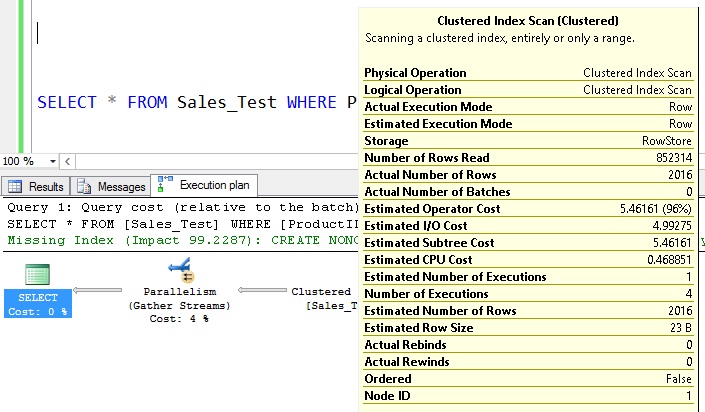
Now we’ll execute the query and see the execution plan:
Observations:
From the histogram EQ_ROWS = 2016 when ProductID = 730.
From the execution plan the estimated number of rows = 2016.
Example 2
SELECT * FROM Sales_Test WHERE ProductID = 735;
From the statistics we can seek for ProductID = 735. From the histogram we can’t find statistics for the product ID 735:
From the histogram you can see there is no value listed under RANGE_HI_KEY for the value 735.
But there is other nearby values: 730 and 735 with the RANGE_ROWS = 1988.
This means there are 1988 rows in the table with the ID’s between (>730 & <738). i.e these 1988 rows should be belongs to any of these ID’s (731, 732, 733, 734, 735, 736 or 737).
Next it checks the column DISTINCT_RANGE_ROWS for 738 and the value is 3. That means from the available 1988 rows there are 3 unique ProductID available.
That means we are not exactly sure how many rows under the each ProductID but we can get the estimated row count by AVG the value: 1988/3 = 662.6667
662.667 is the estimated row count when ID in (731, 732, 733, 734, 735, 736 or 737).
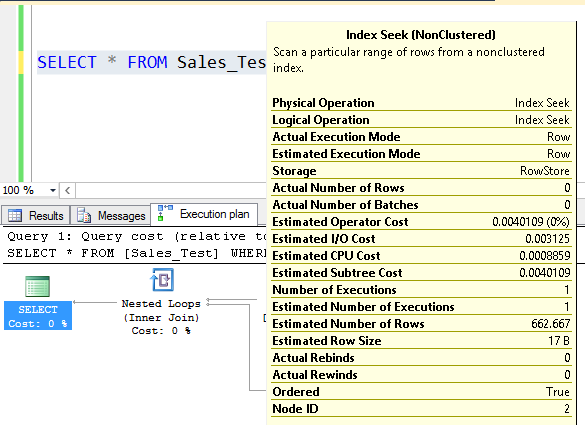
Now we’ll execute the query and see the estimated row count:
Observations:
In the histogram there is no row exist for the product value: 735
From the histogram AVG_RANGE_ROWS = 662.6667 when ProductID = 738
From the execution plan the estimated number of rows = 666.6667
Summary:
In this post we learned how SQL Server optimizer use Statistics and Histogram to get the cardinality estimates.
When you are having proper indexes designed and statistics are updated it leads to the accurate histogram which produce the optimized execution plan
There are two major things that we need to understand “Histogram” and “Density Vector”.


[…] a table “Sales_Test” and insert data. Here is the […]