Learning Microsoft Power BI Lesson 3

Learning Microsoft Power BI Lesson 3

Learning Microsoft Power BI Lesson 3 – Exploring Power BI Desktop

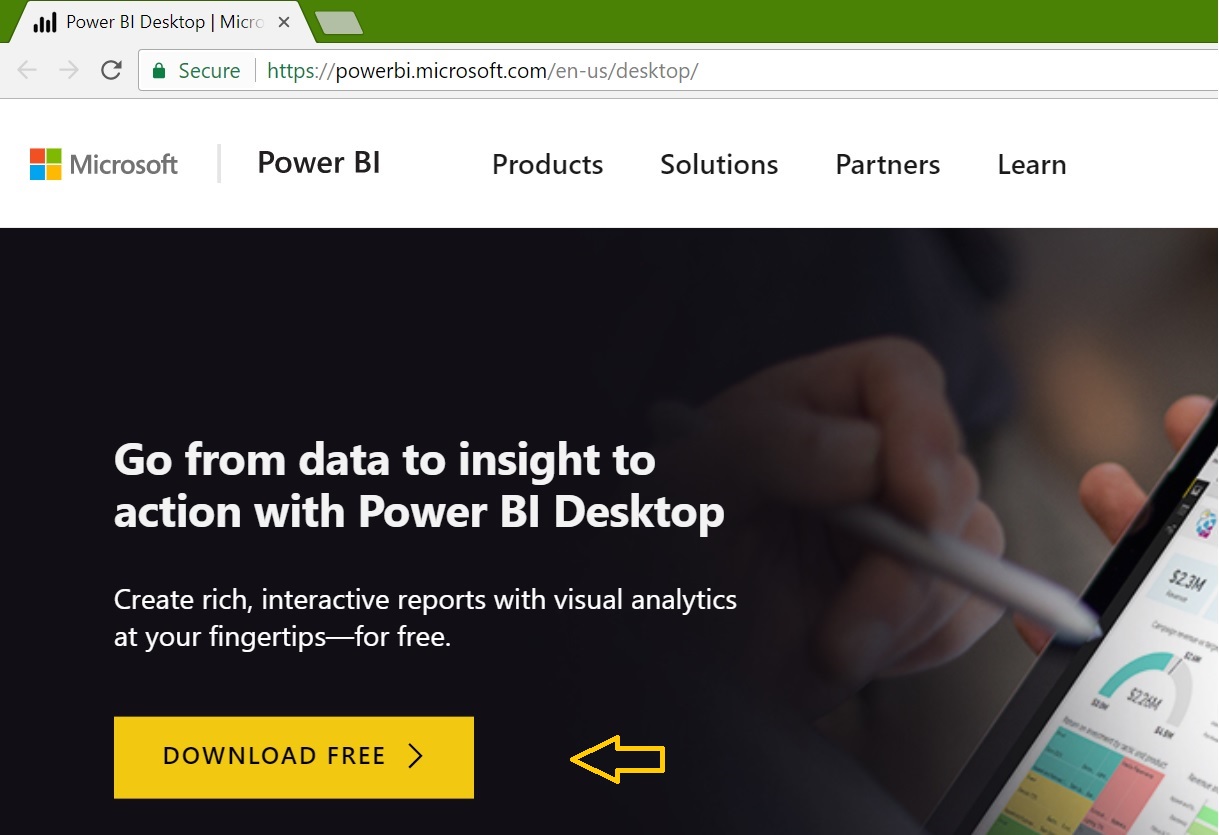
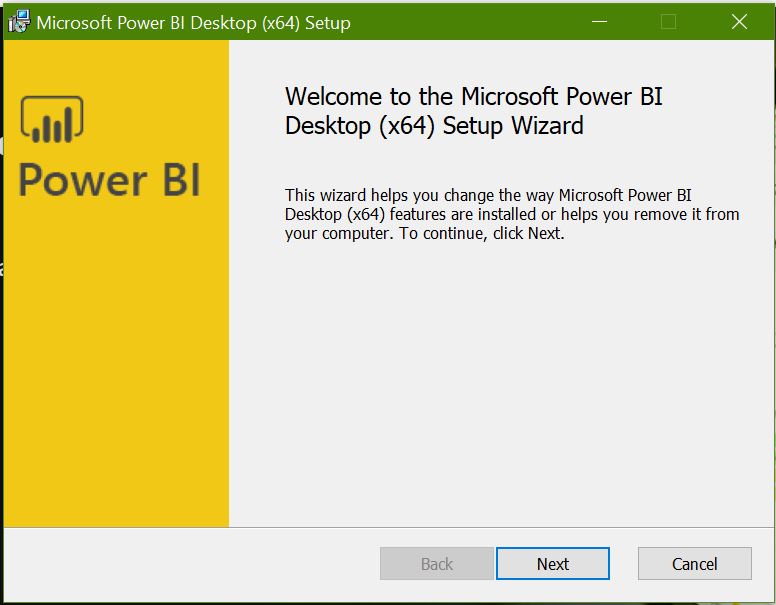
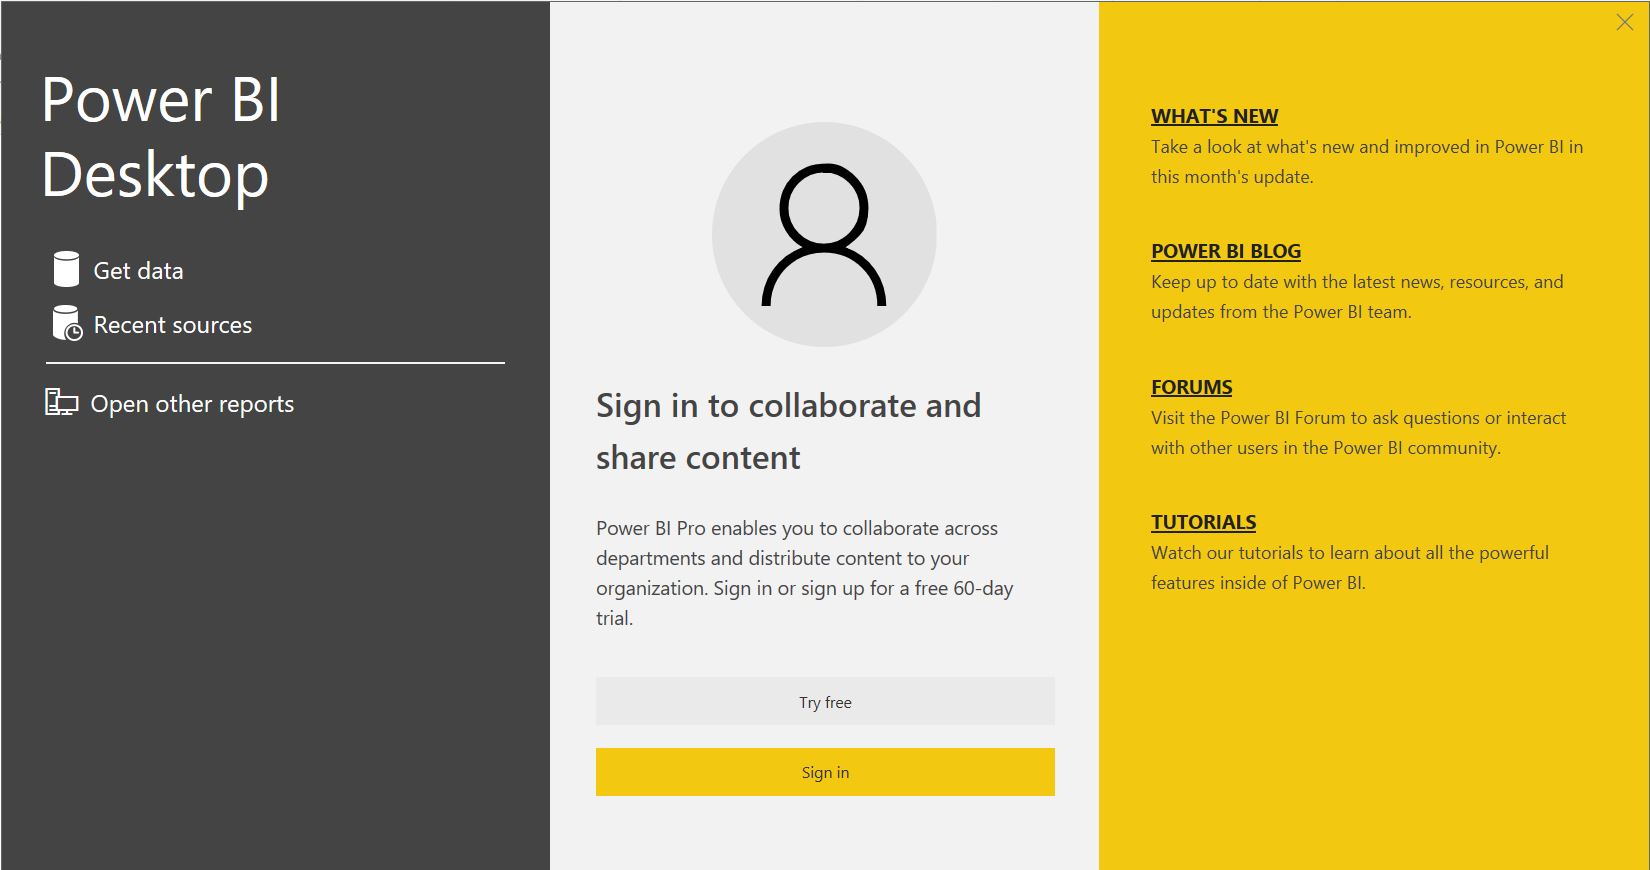
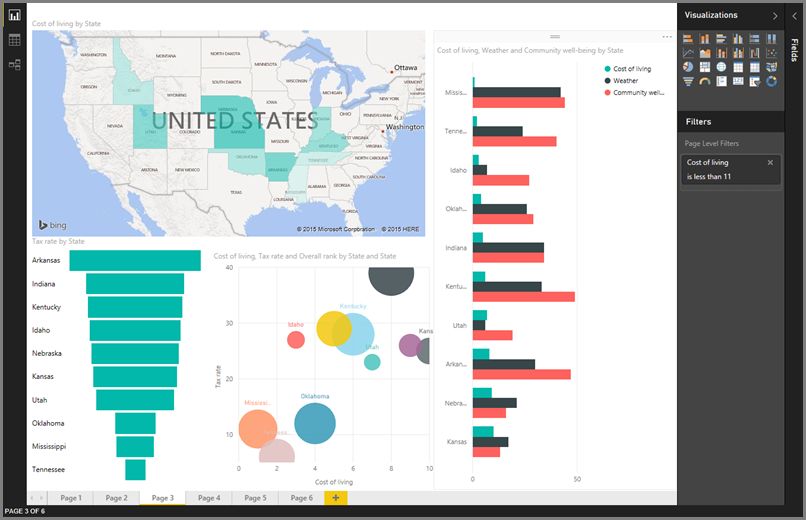
The post “Learning Microsoft Power BI Lesson 3” takes you through the overview and creating the first report using Power BI desktop. Here we have seen how to install the Power BI Desktop on Windows. Now we’ll open it and explore the features:
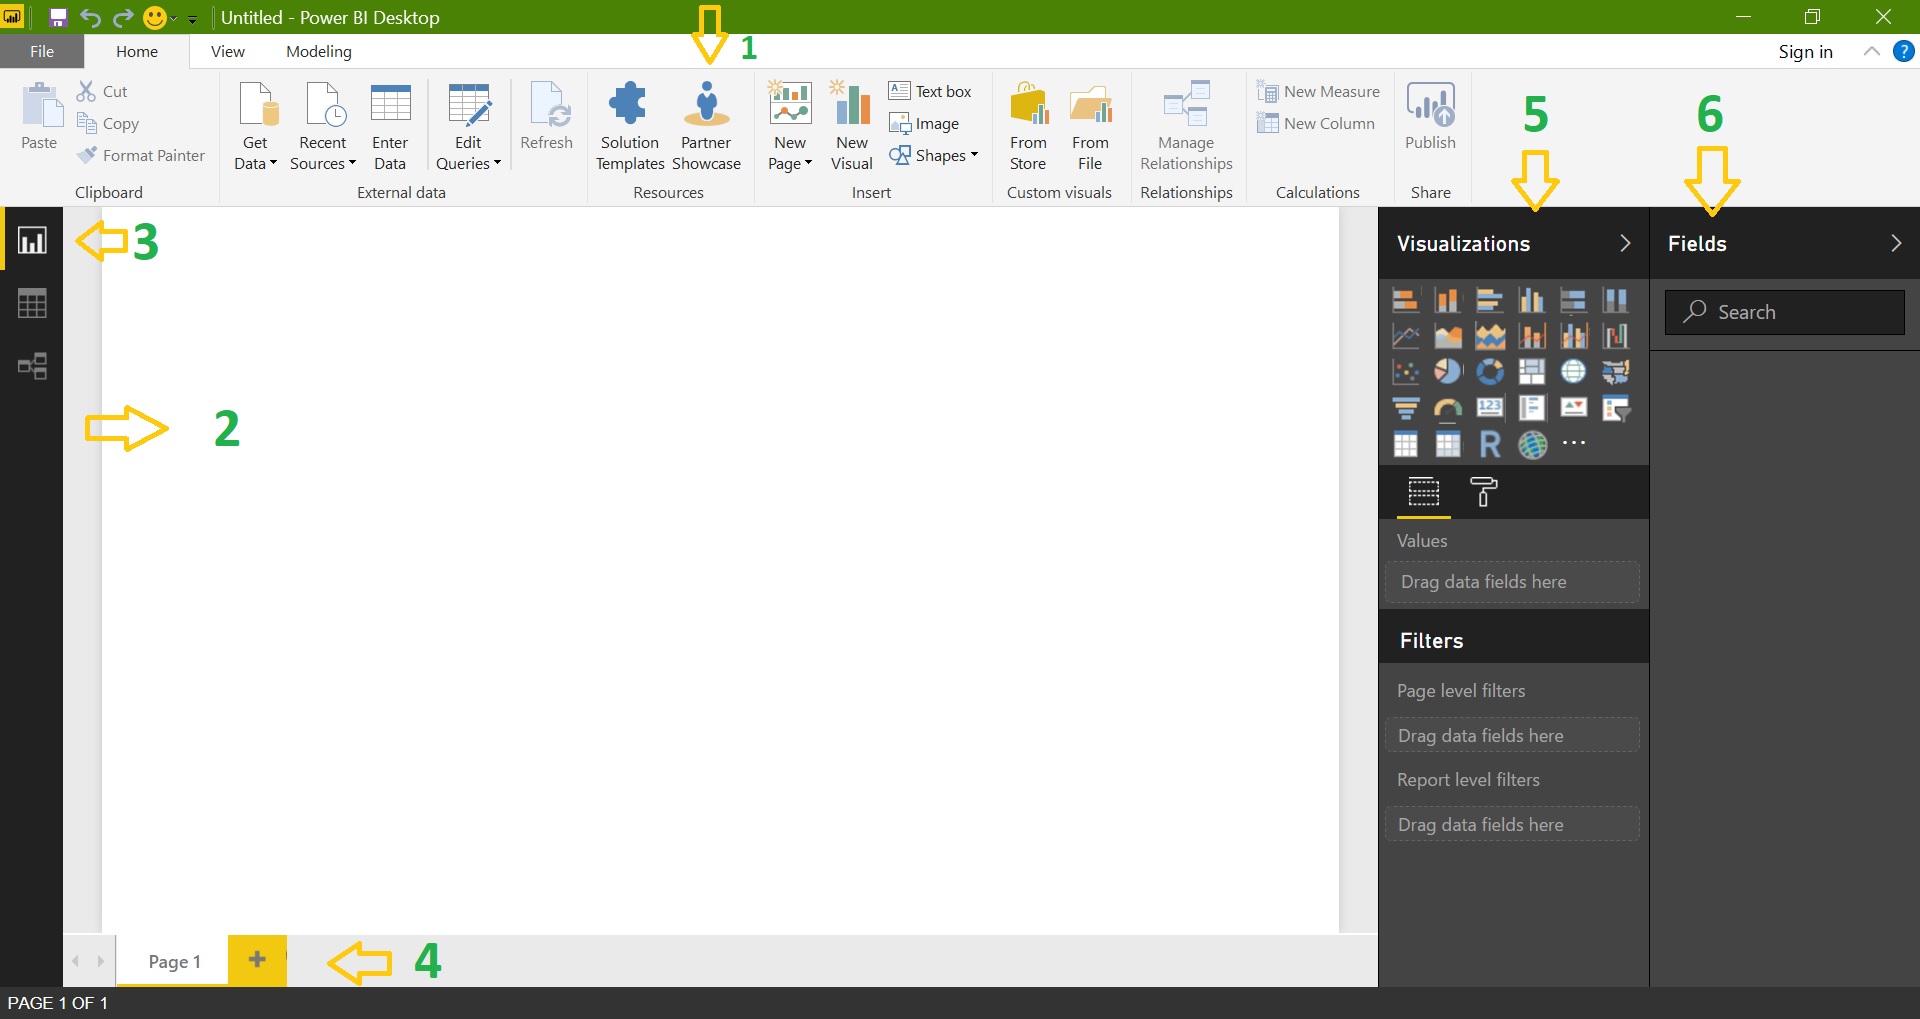
Power BI Desktop:

Power BI Desktop has 6 main areas:

  1. Toolbar: It contains a set of tools which are used to get data, develop and publishing the reports
  2. Report View / Canvas: Here we actually give life to data using various visualizations
  3. Ribbon: Showcase the common tasks which are associated with the reports and visualizations
  4. Pages: Allows us to add, remove pages in a report
  5. Visualizations: Where we can add, change visualizations, customize colors or axes, apply filters, drag fields etc.
  6. Fields: Where query elements and filters can be dragged onto the Report view, or dragged to the Filters area of the Visualizations pane

 Learning Microsoft Power BI Lesson 3

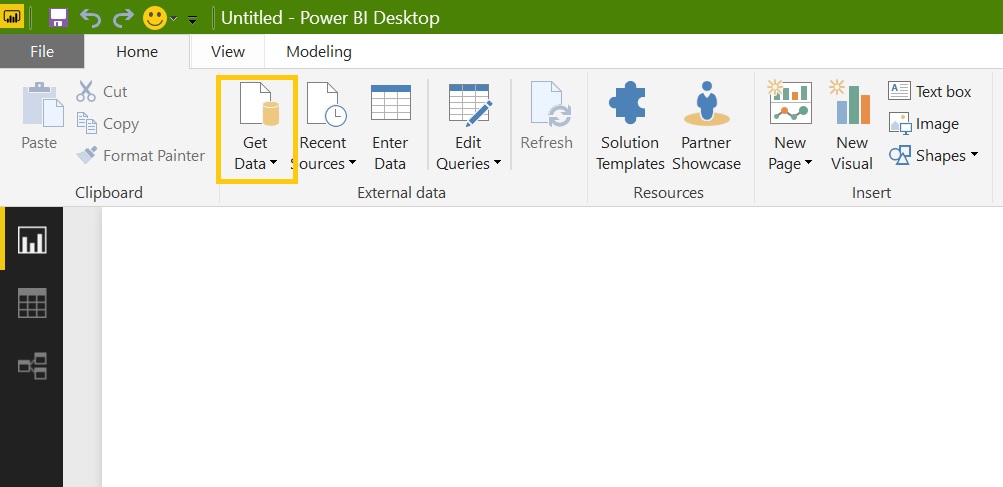
Getting Data into Power BI:

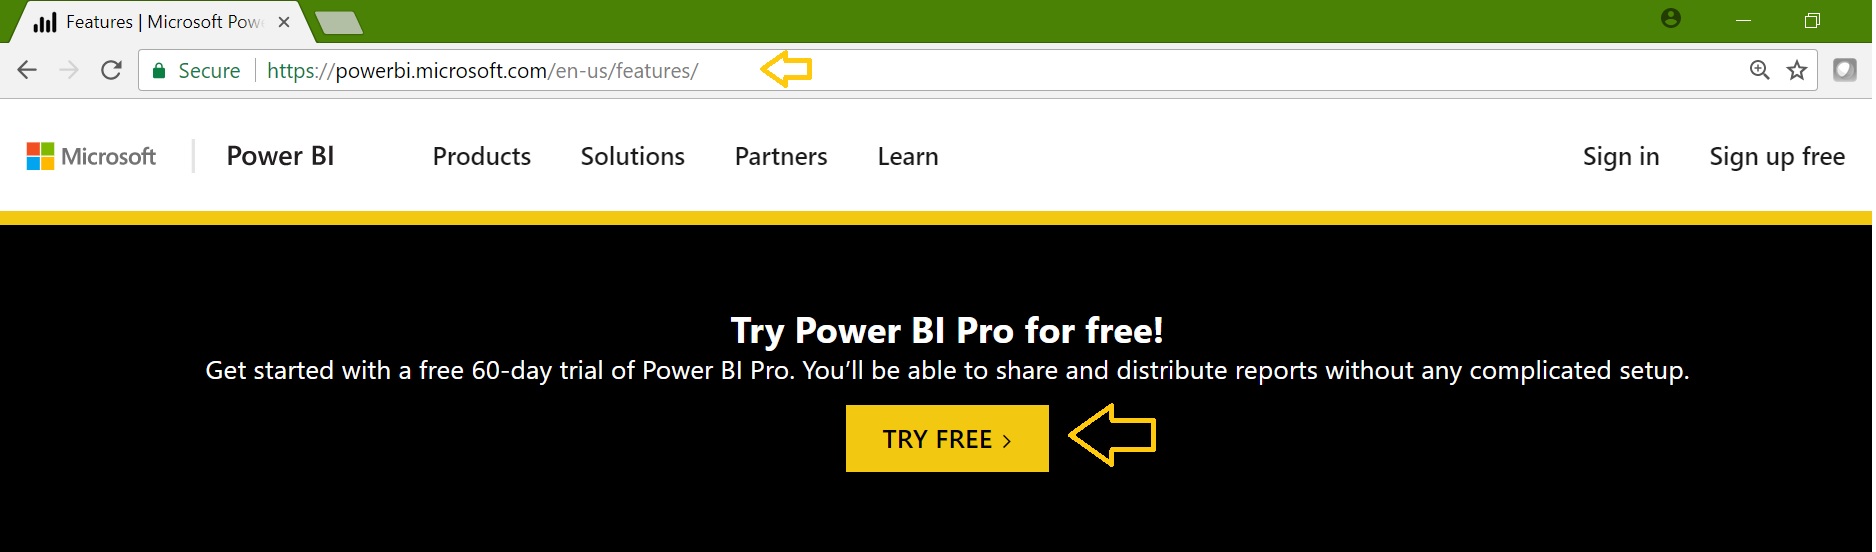
We’ll see how to load data from a source to Power BI Desktop. Power BI is a data centric application thereof we need to focus on providing the clean data as per the business requirement. Currently Power BI supports 70 + data sources and these are categorized into 5 types:

File: Excel, Text, CSV, XML, JSON, Folder, SharePoint Folder

Database: Ex: SQL Server, Oracle, DB2, PostgreSQL, SAP, MySQL, Amazon Redshift, Impala etc.

Azure: Ex: Azure SQL Database, Blog Storage, Azure Table Service etc.

Online Services: Ex: Dynamics 365, Sales Force / Reports, Facebook, GitHub etc.

Other: Ex: R Script, OLEDB, ODBC, Hadoop File, Active Directory etc.

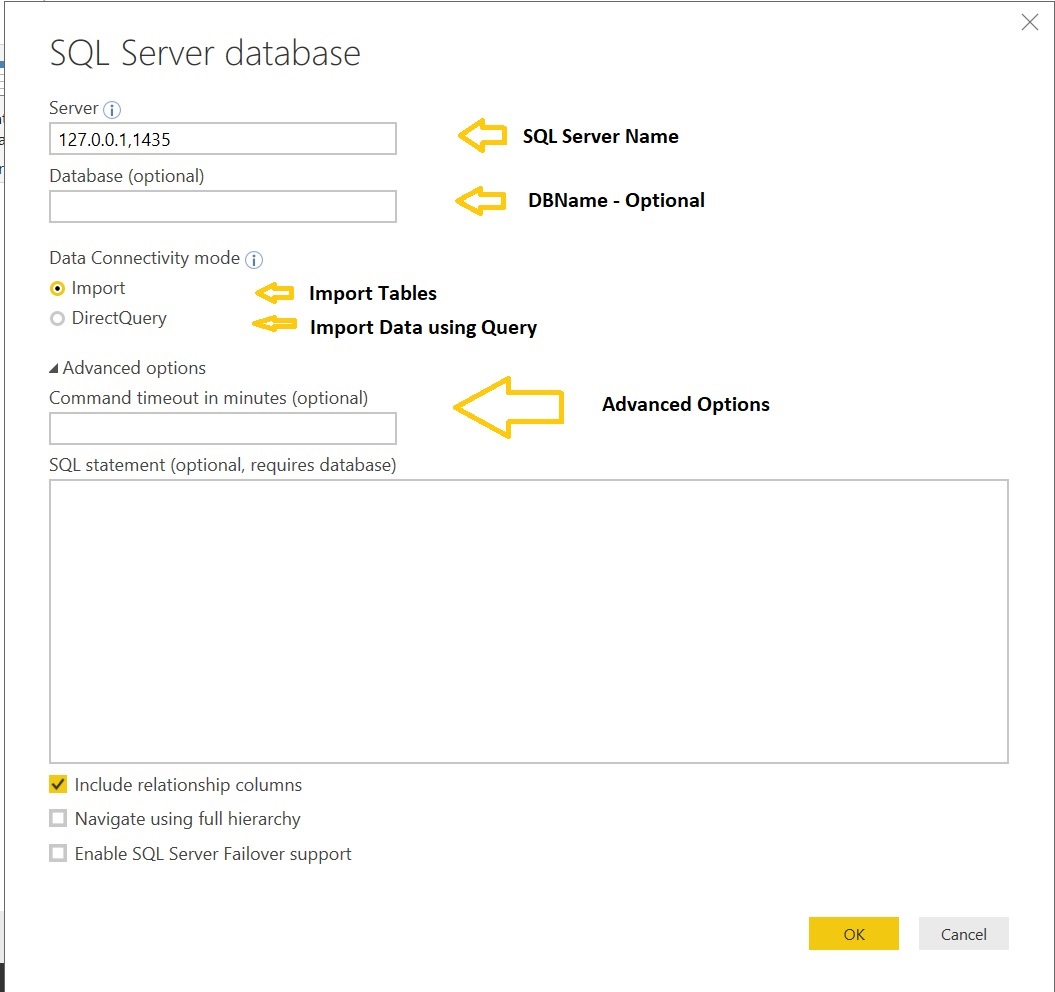
I would suggest download and attach/restore [AdventureWorksDW2014]

Learning Microsoft Power BI Lesson 3 Learning Microsoft Power BI Lesson 3

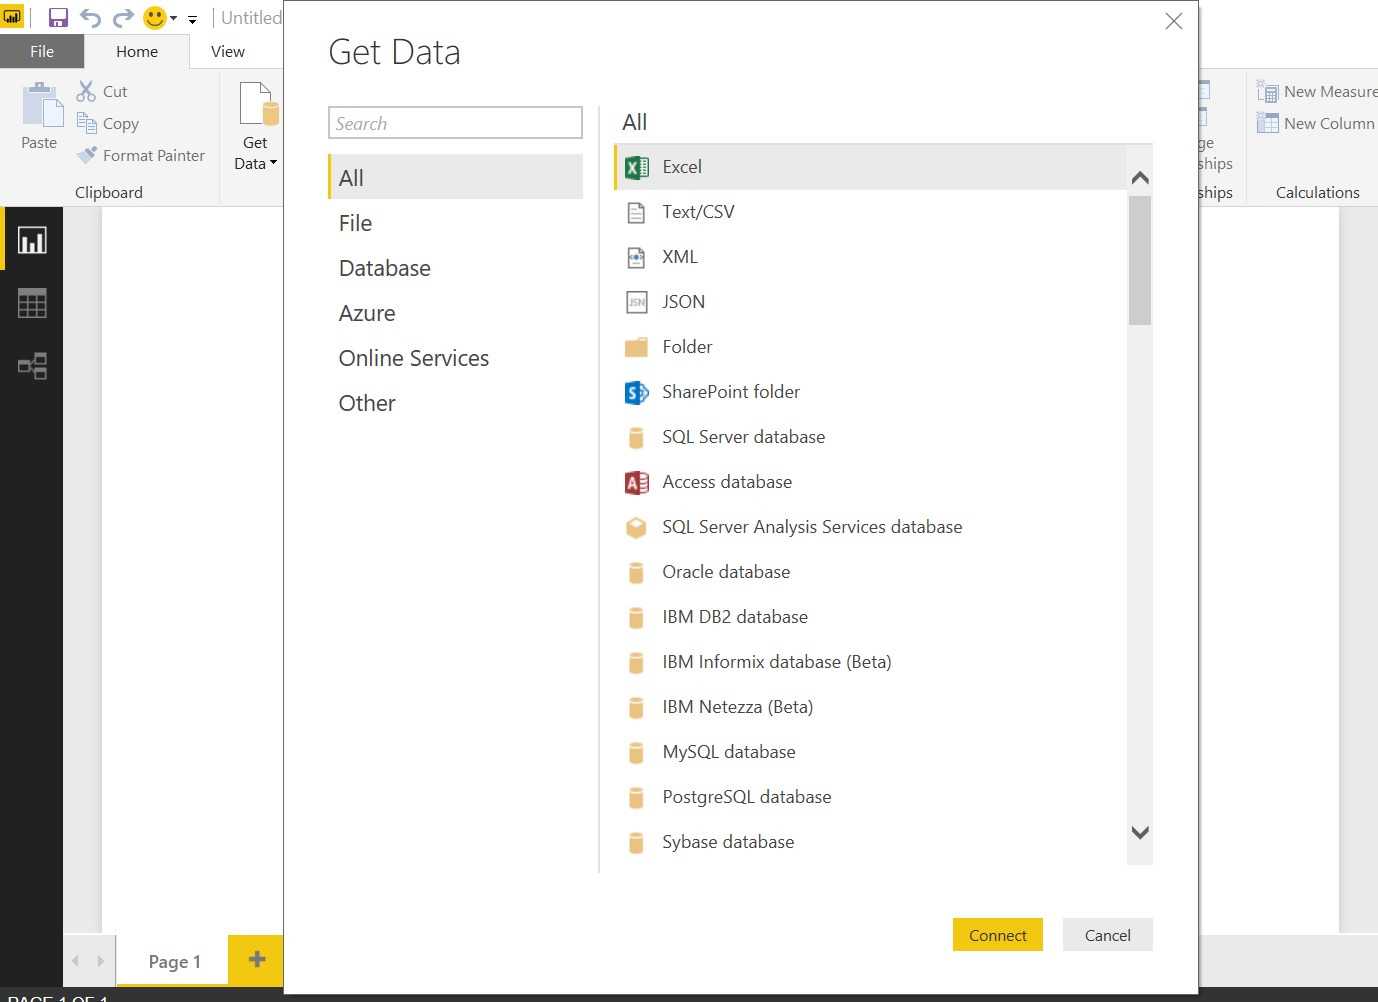
Select SQL Server Database and connect it:

Learning Microsoft Power BI Lesson 3

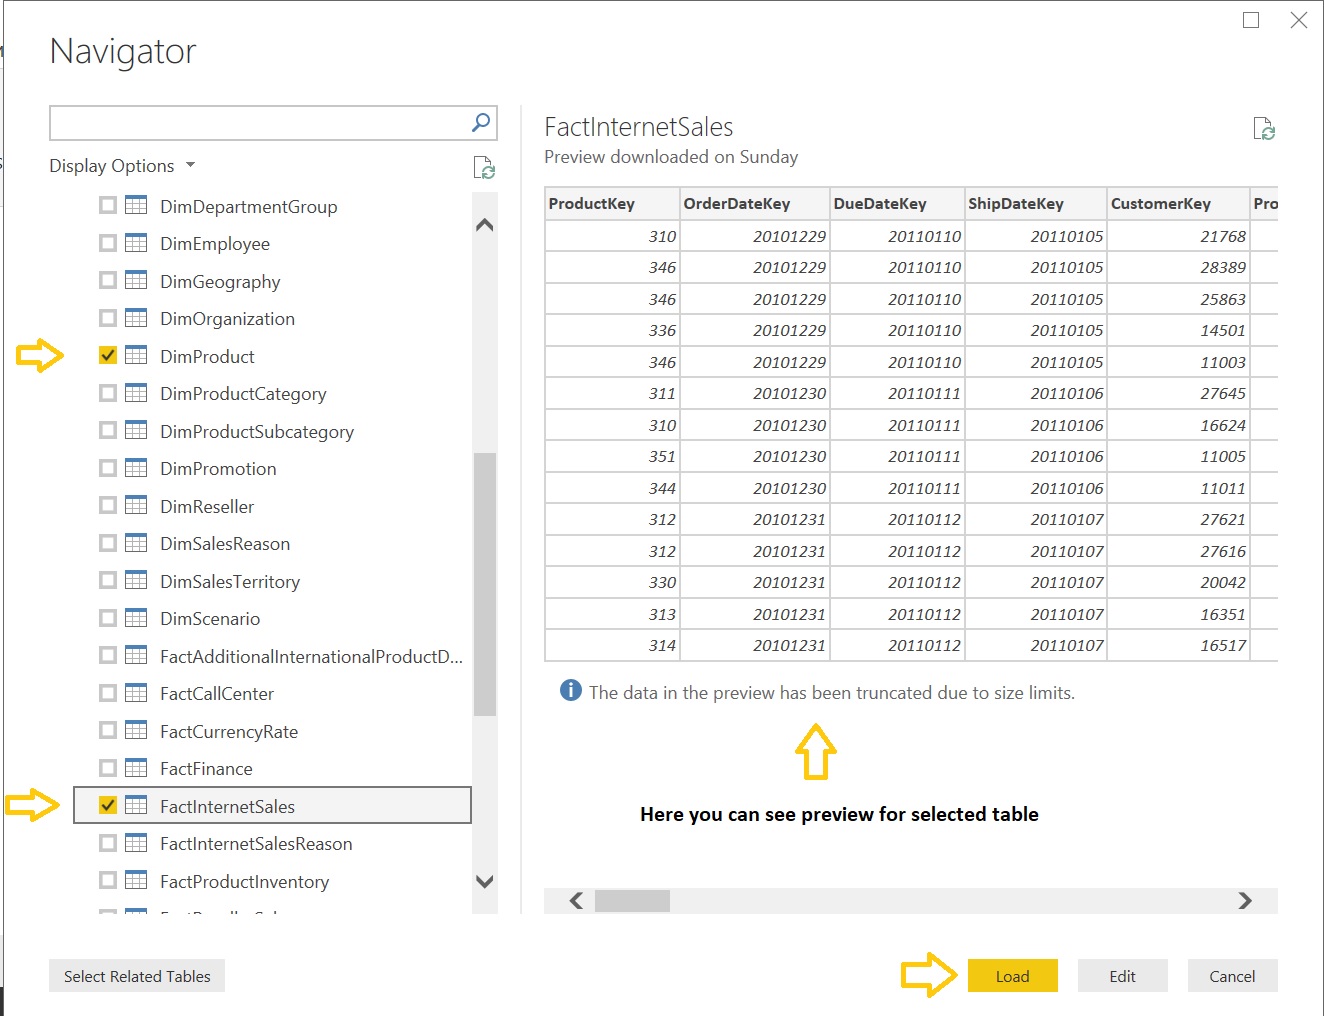
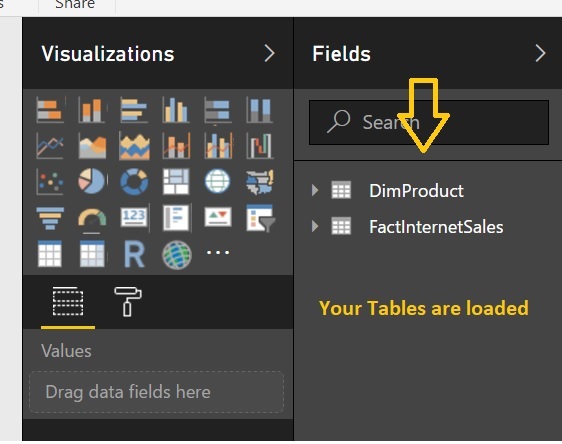
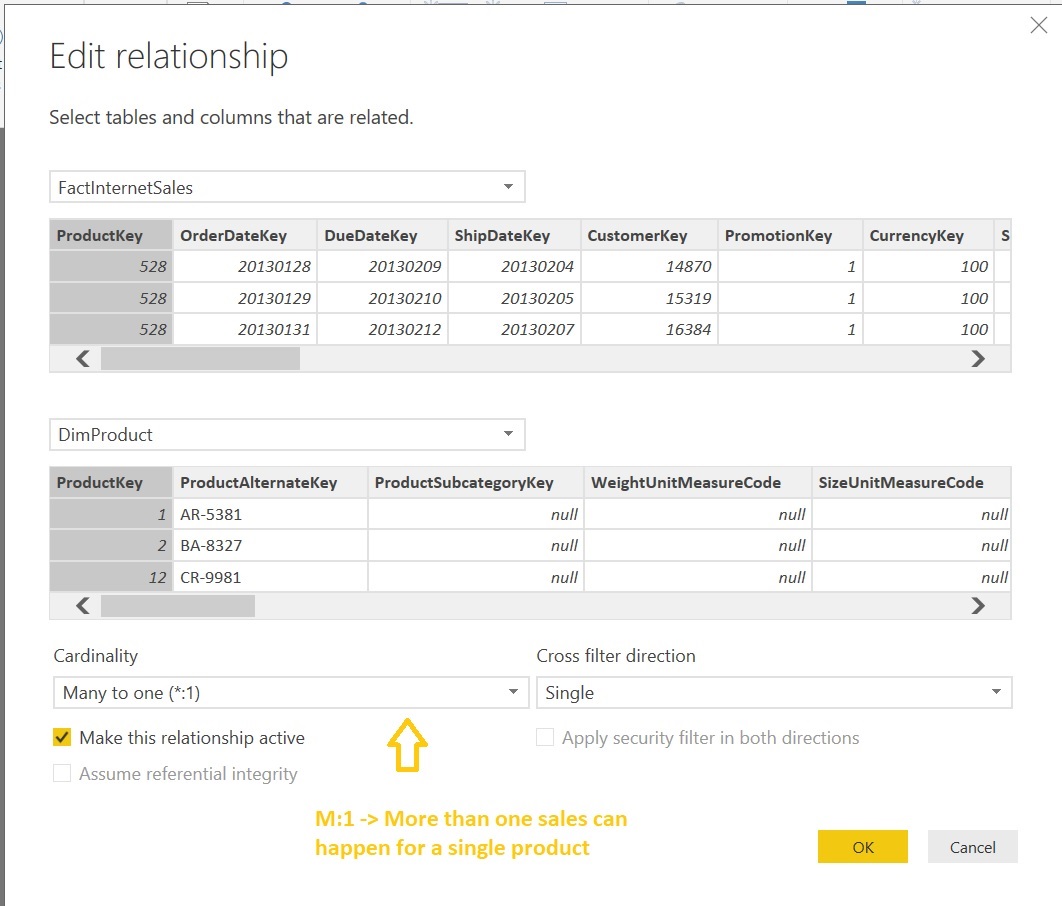
Now we have to select tables to import from SQL Server to Power BI. We’ll choose two tables from database [AdventureWorksDW2014]:

[DimProduct]: It stores product properties / metadata that might include name, color, height, weight, stock, price etc.

[FactInternetSales]: It stores product sales information that might include sale amount, tax amount, date info, discount info etc.

 Note: If you are new to dimensions and facts don’t worry about it, just google it and see what is a FACT and Dimension. To simplify fact indicates numbers / measures and Dimension gives a meaning to fact using its properties / metadata. Ex: If I say 5 Cameras it’s just a measure which doesn’t have any meaning now if I say Mr.Chris has purchased 5 EOS cameras from Canada e-store on 14-Sep-17 gives a proper meaning. Here 5 is the FACT and dimensions are Customer (Chris), Product (Camera details), Country (Canada), Store (e-store) and Date.

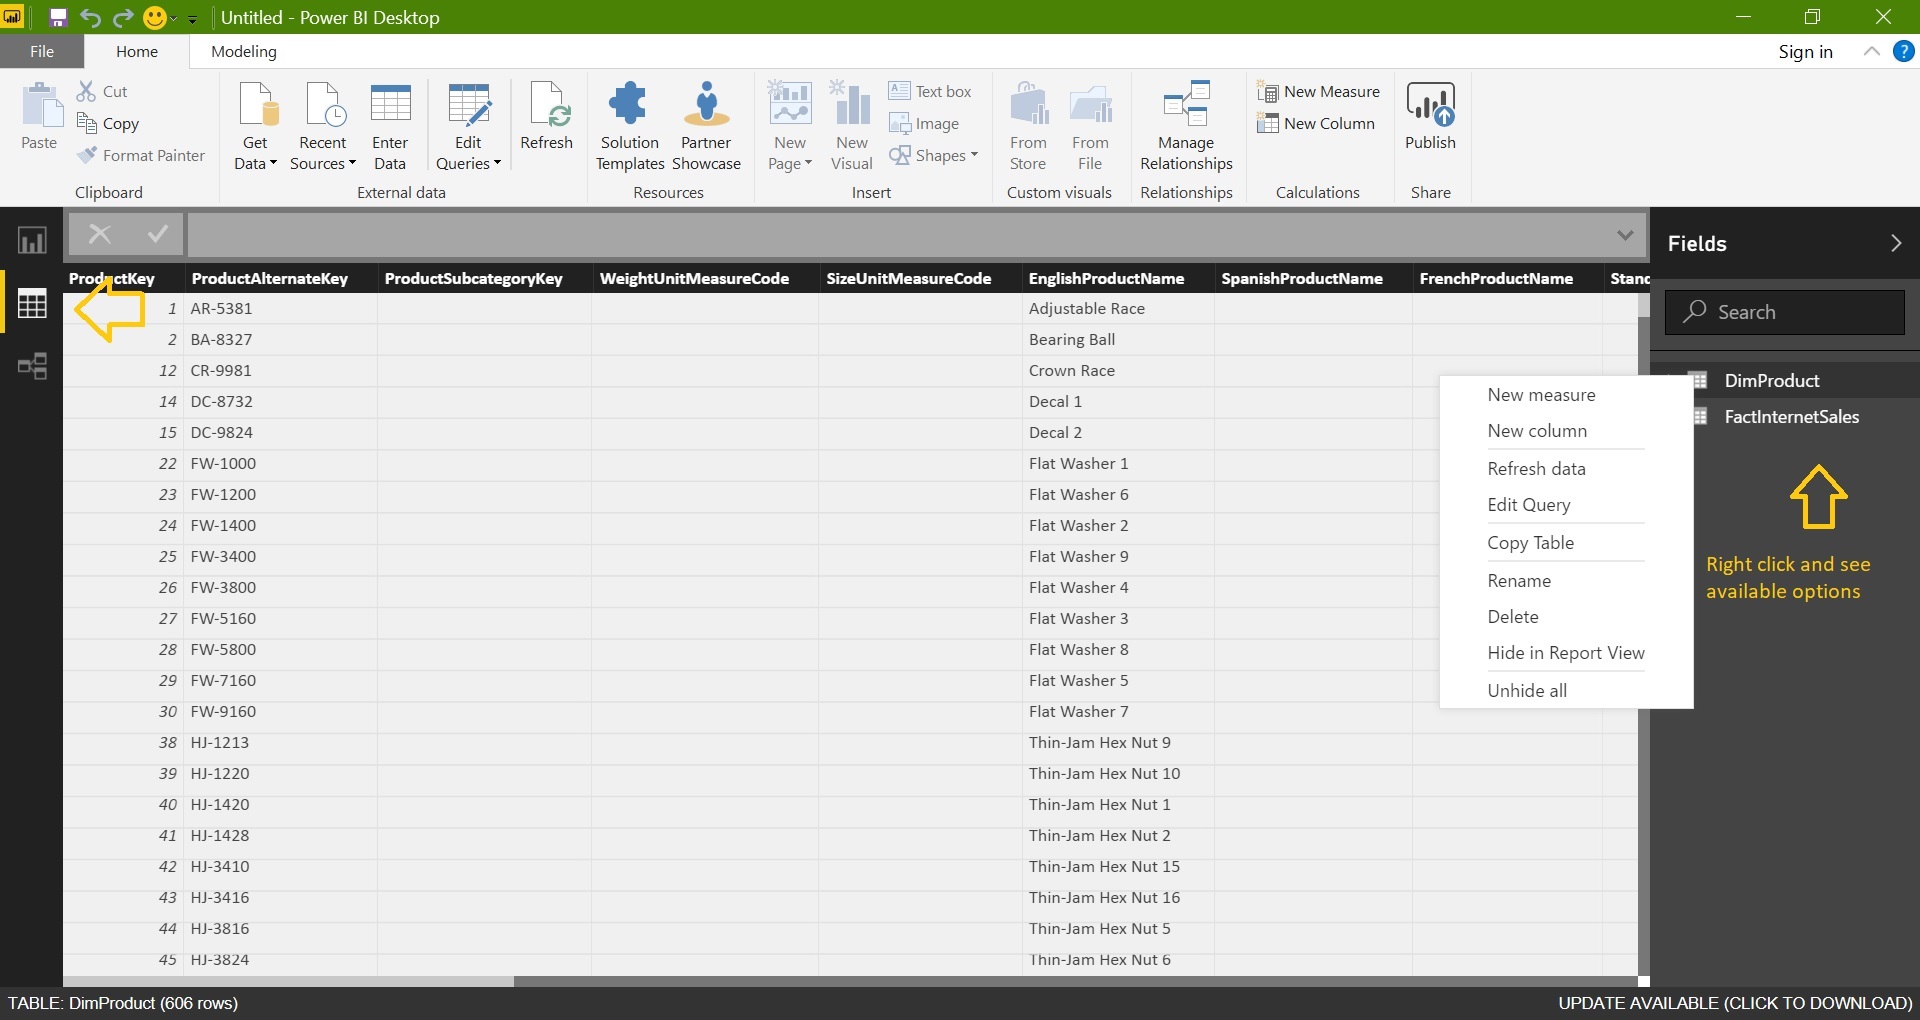
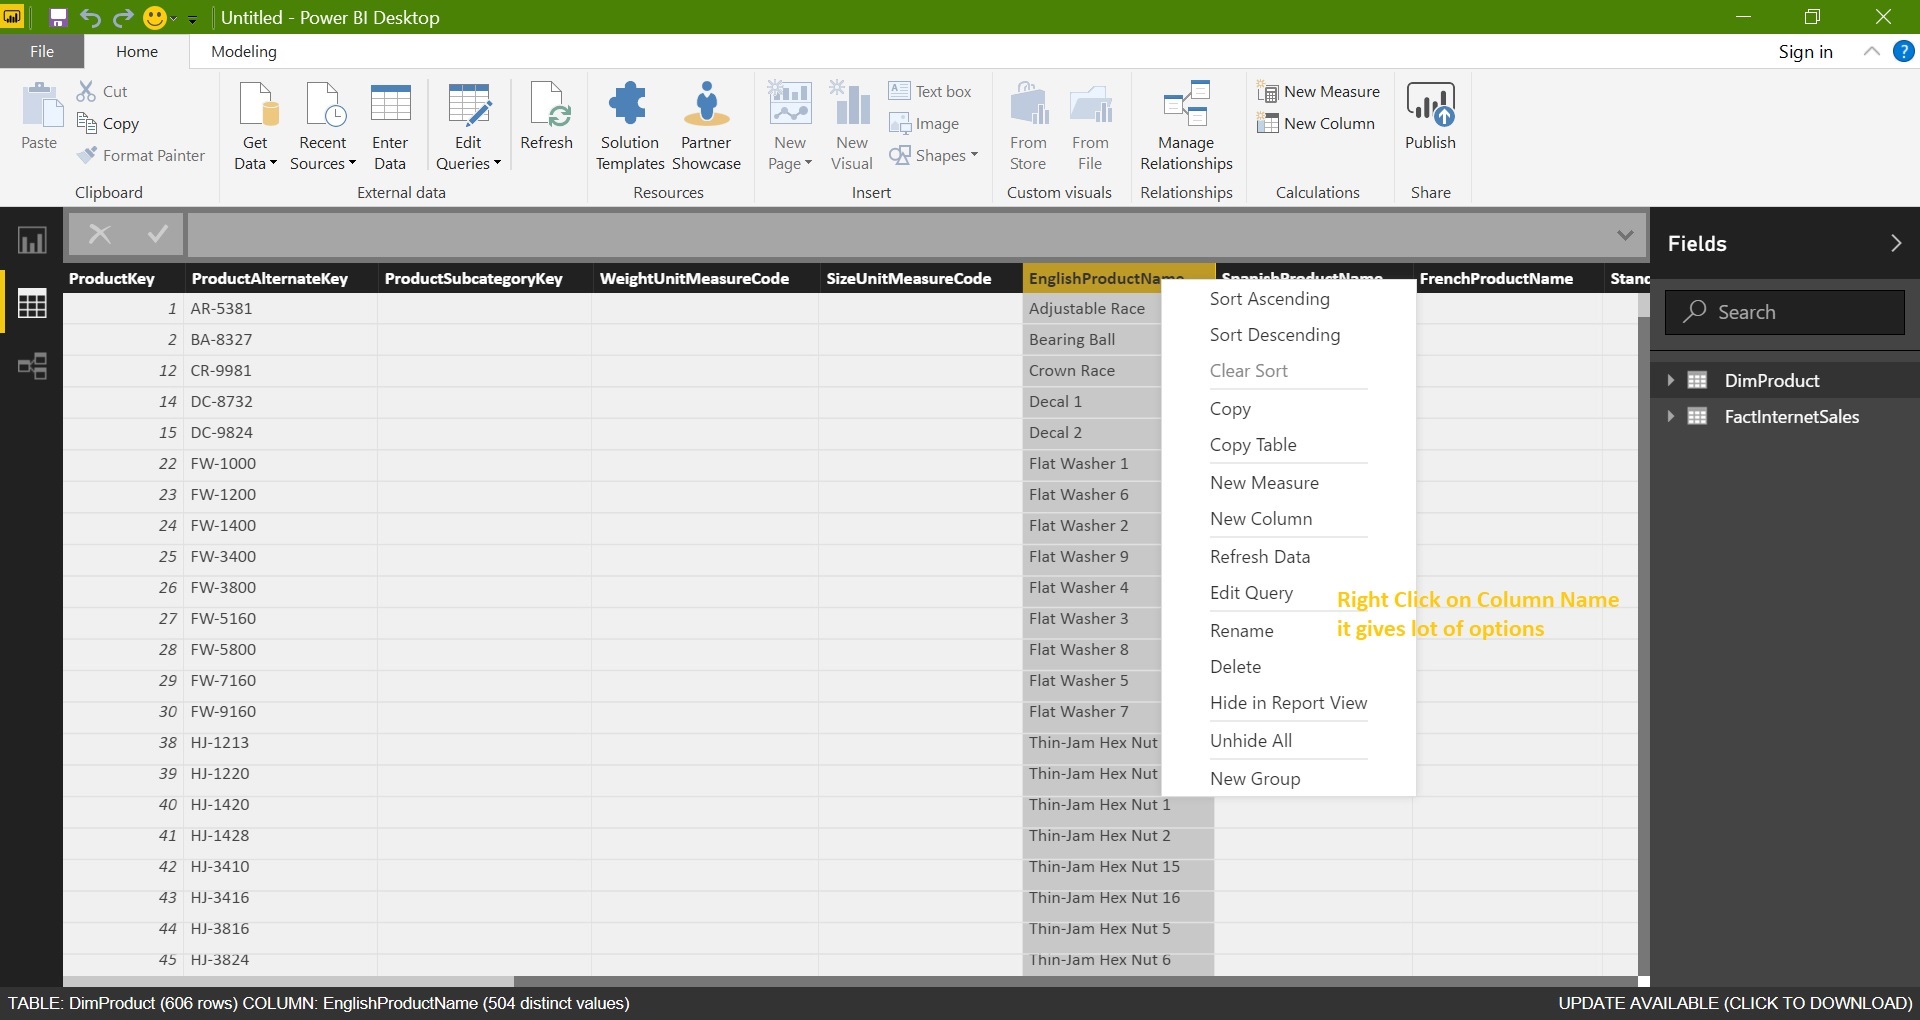
Import above tables into Power BI:

Just try to go with the flow, we are just exploring the Power BI desktop for the first time and not going to try all the options in one go.

Learning Microsoft Power BI Lesson 3 Learning Microsoft Power BI Lesson 3 Learning Microsoft Power BI Lesson 3 Learning Microsoft Power BI Lesson 3 Learning Microsoft Power BI Lesson 3 Learning Microsoft Power BI Lesson 3

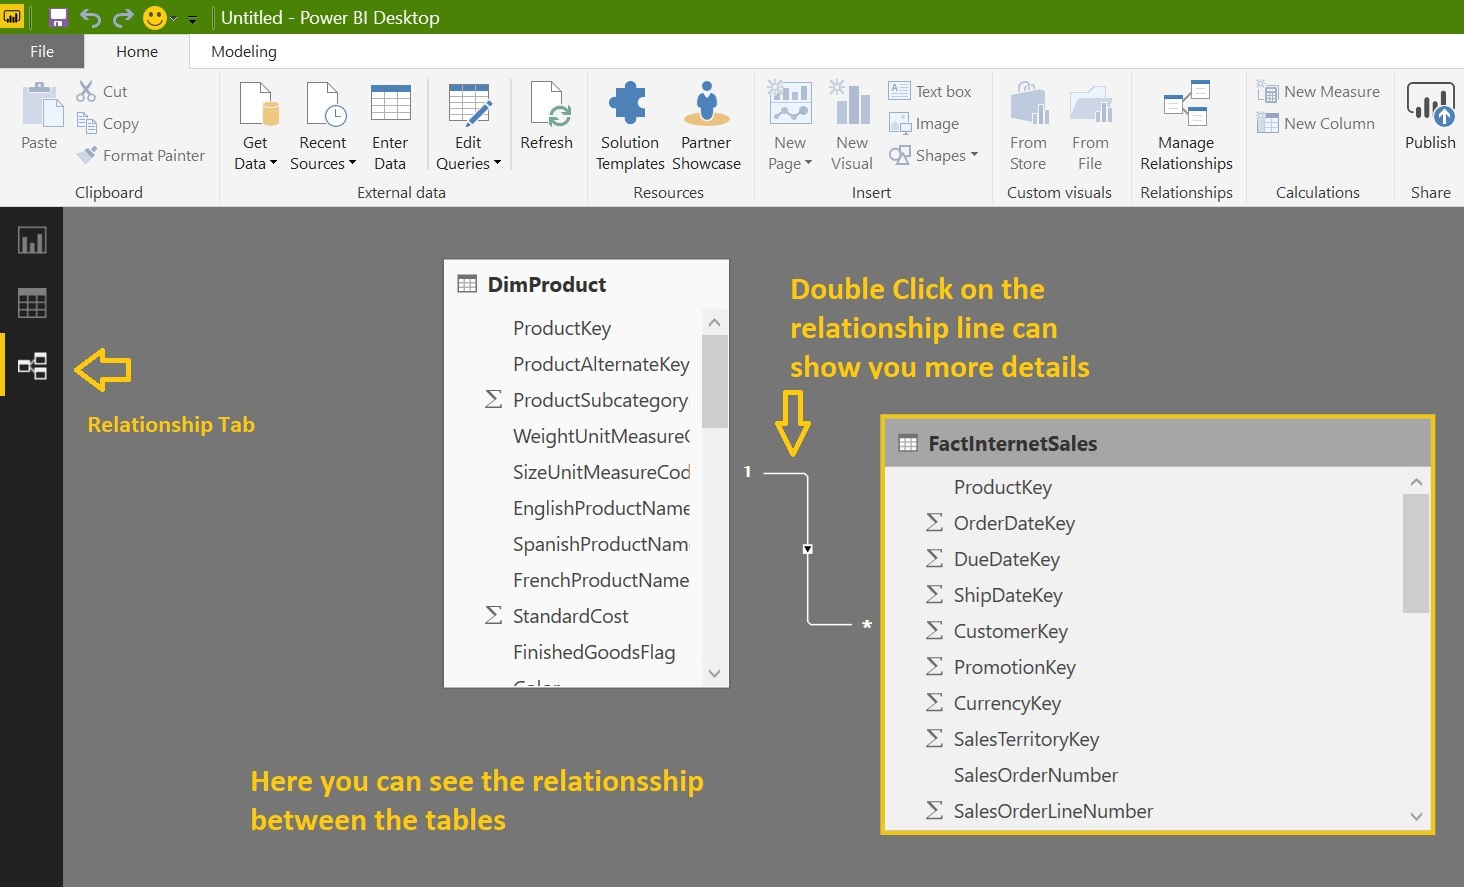
Go back to the Report TAB and now we are going to design a simple report:

Learning Microsoft Power BI Lesson 3 Learning Microsoft Power BI Lesson 3

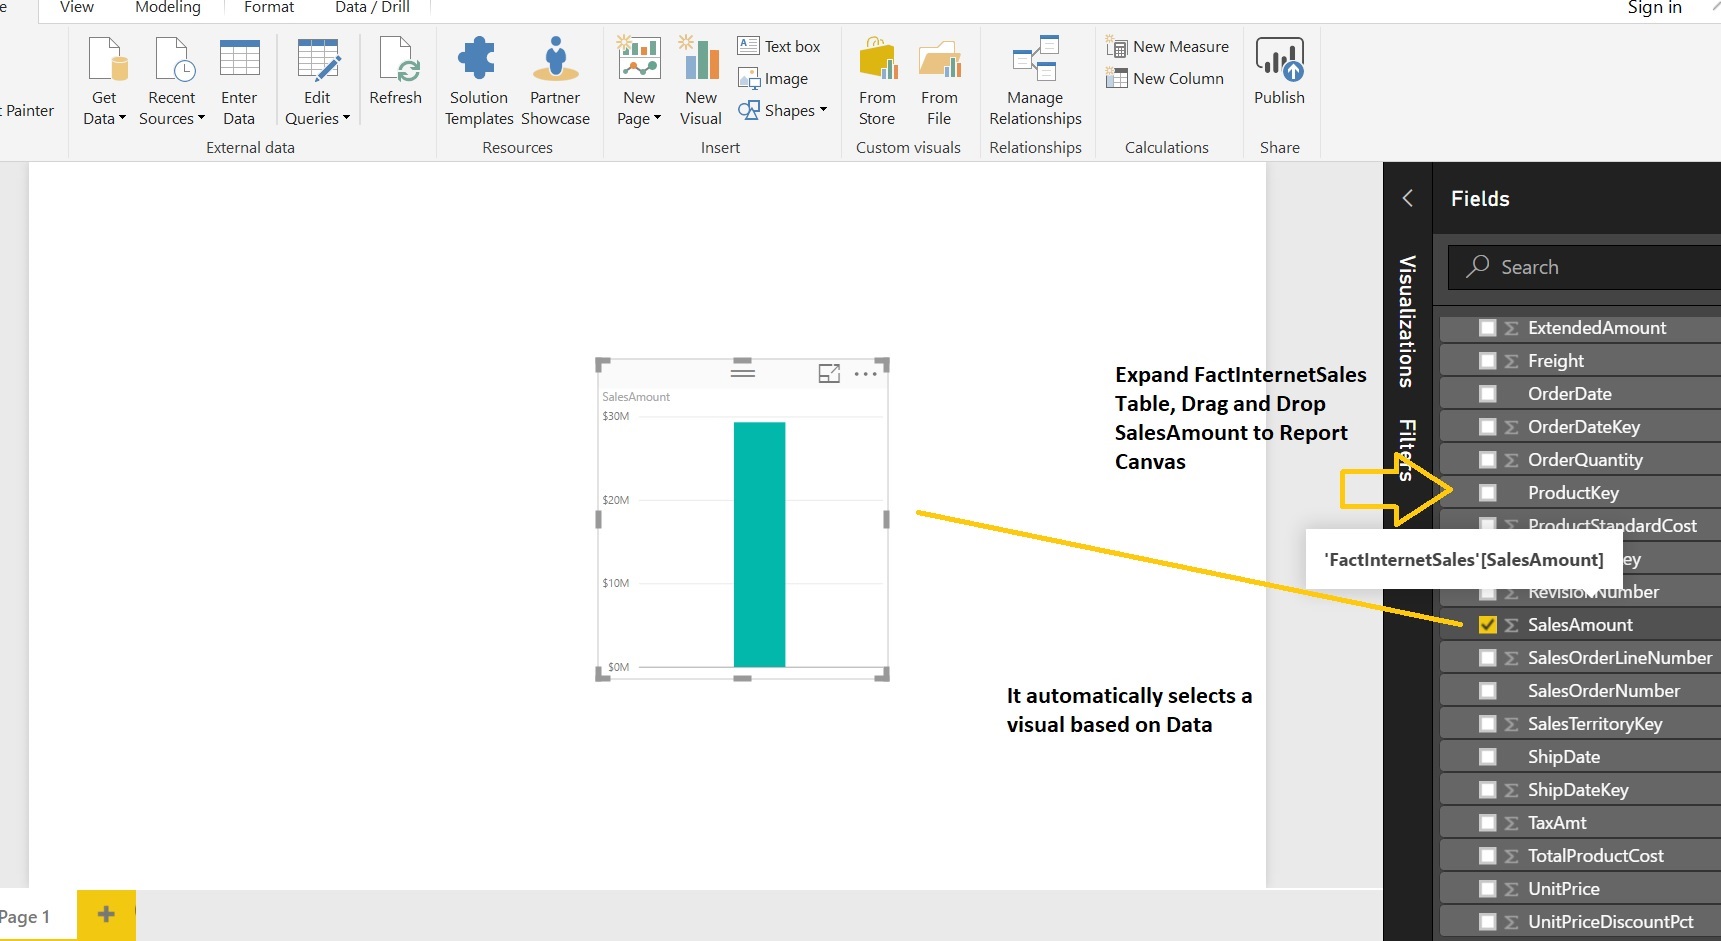
Let’s have a look at Visual (Clustered Column Chart) Properties:

Learning Microsoft Power BI Lesson 3 Learning Microsoft Power BI Lesson 3

We’ll use “Fields” and “Format” tabs and apply few customization:

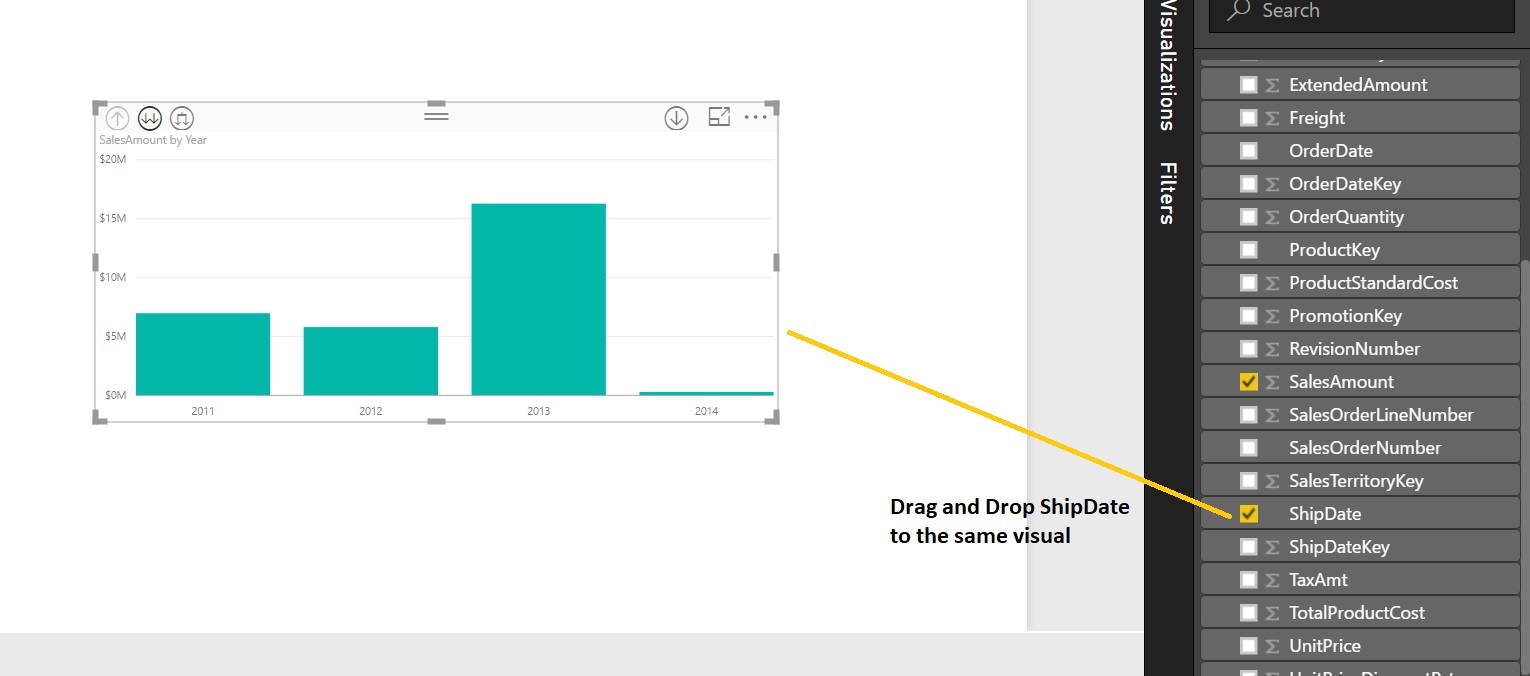
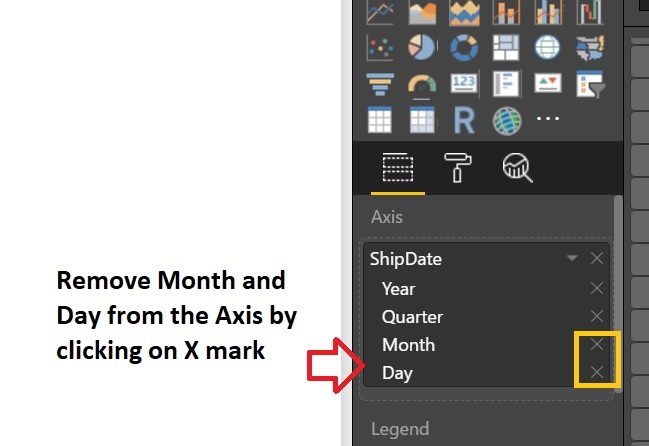
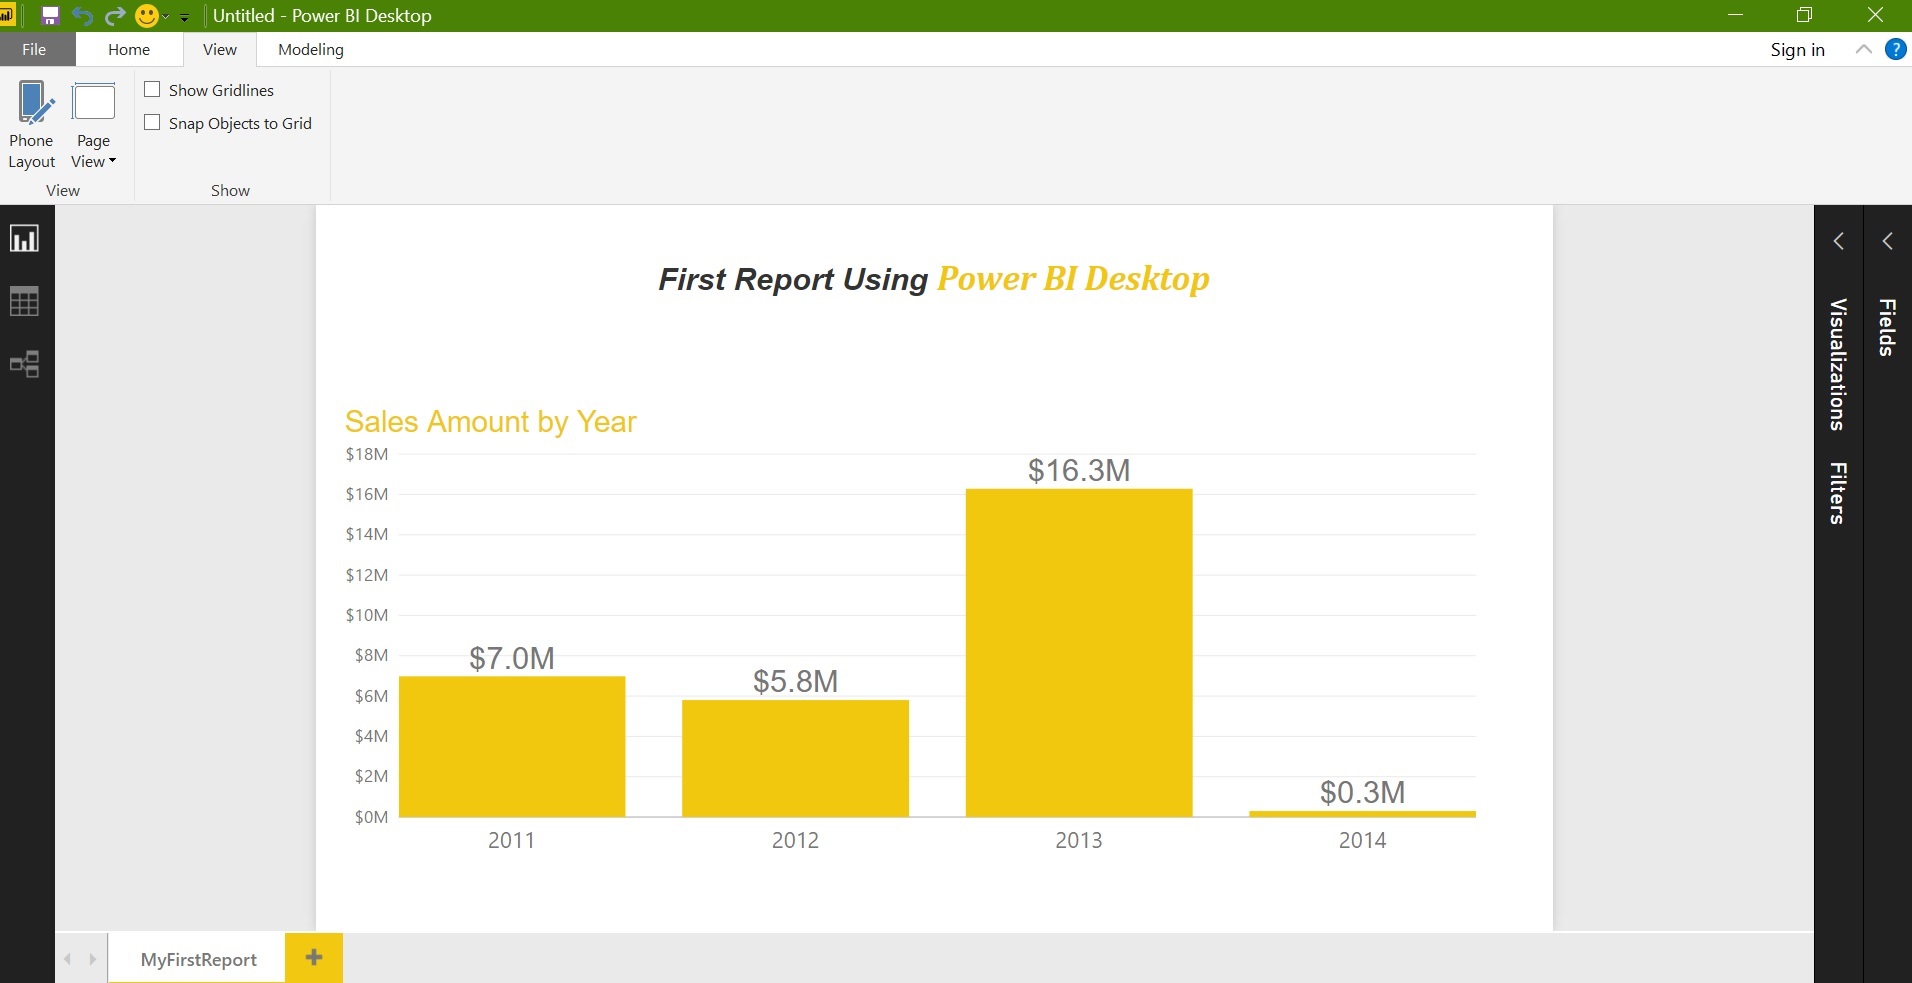
The chart is showing the Sales Amount based on the “ShippingDate”. It’s automatically groups data based on “Year”, “Quarter”, “Month” and “Day”. We’ll remove Month and Day as we just required Year and Quarter.

Learning Microsoft Power BI Lesson 3

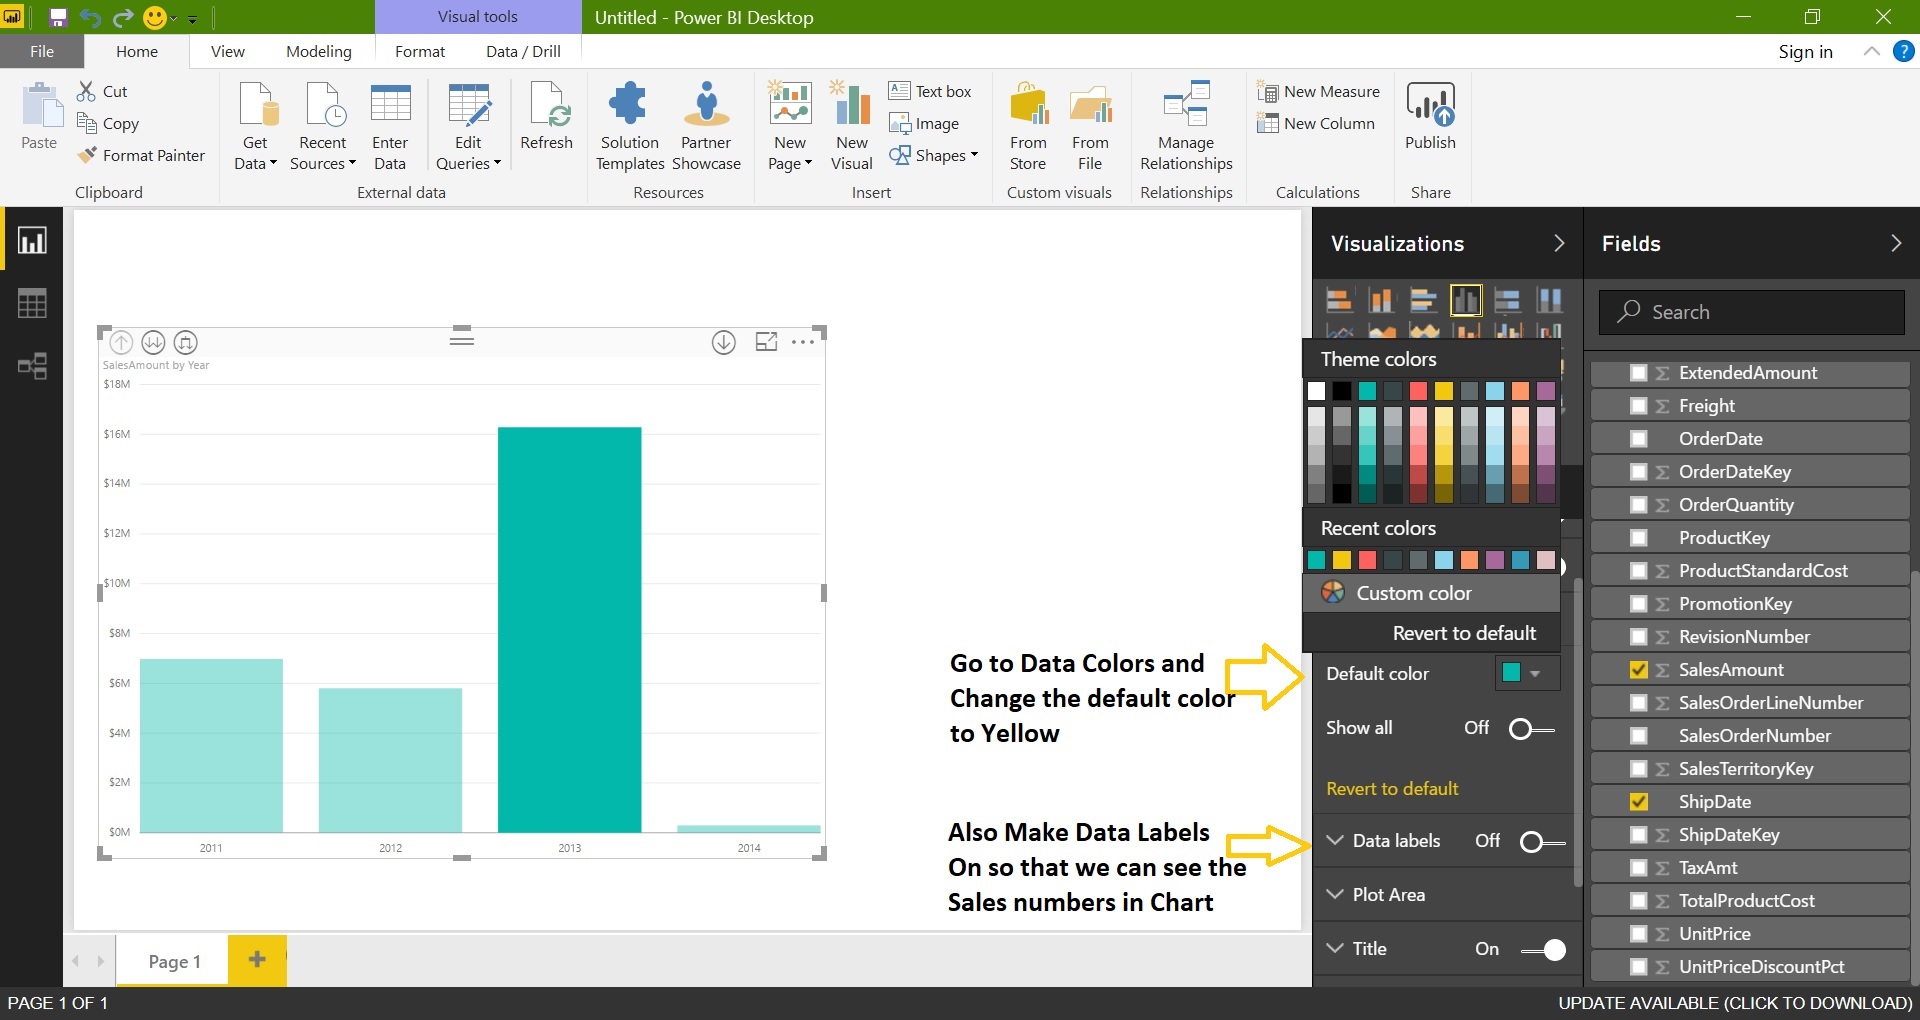
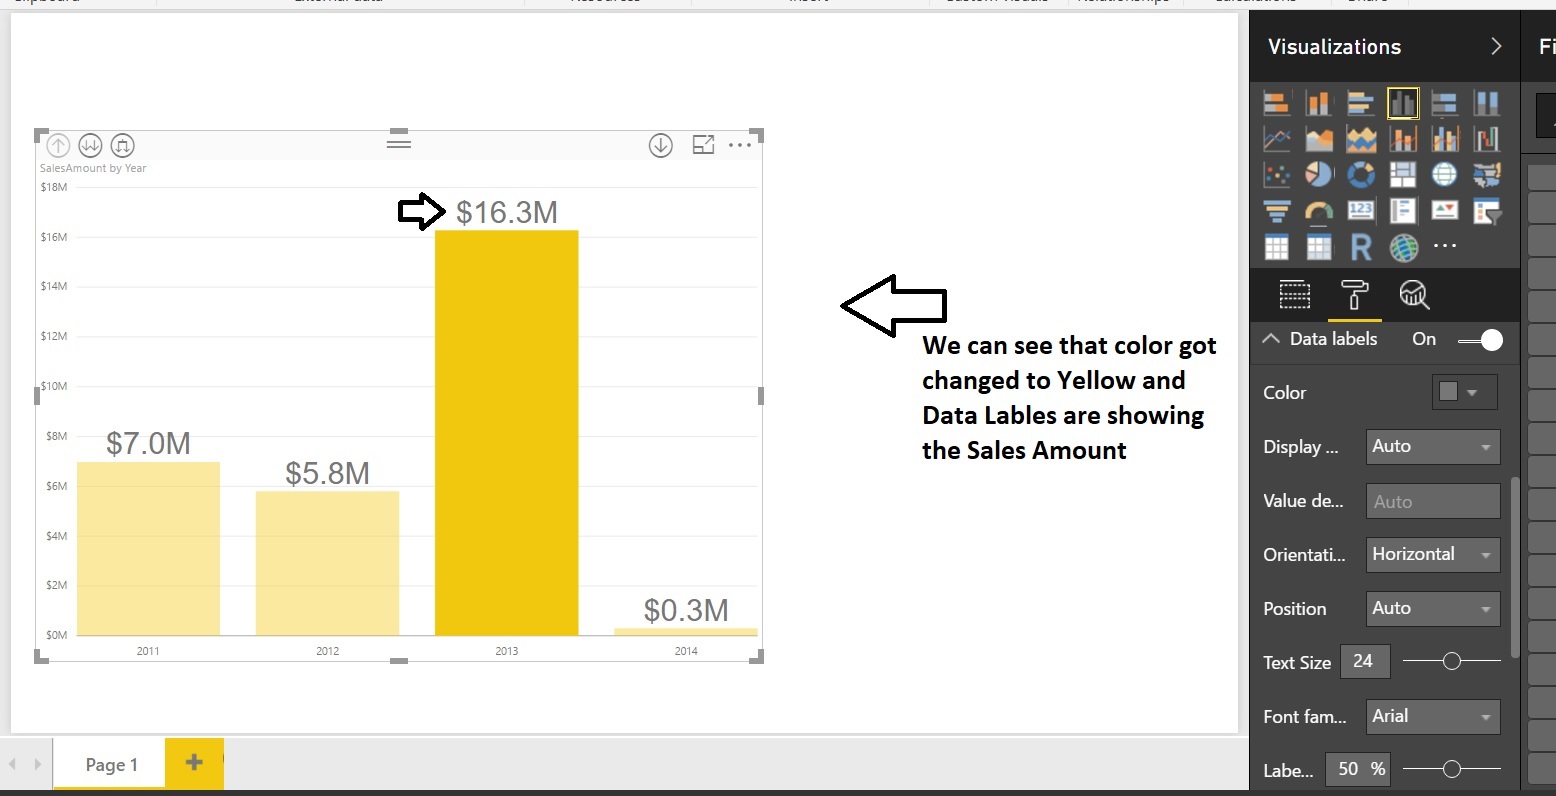
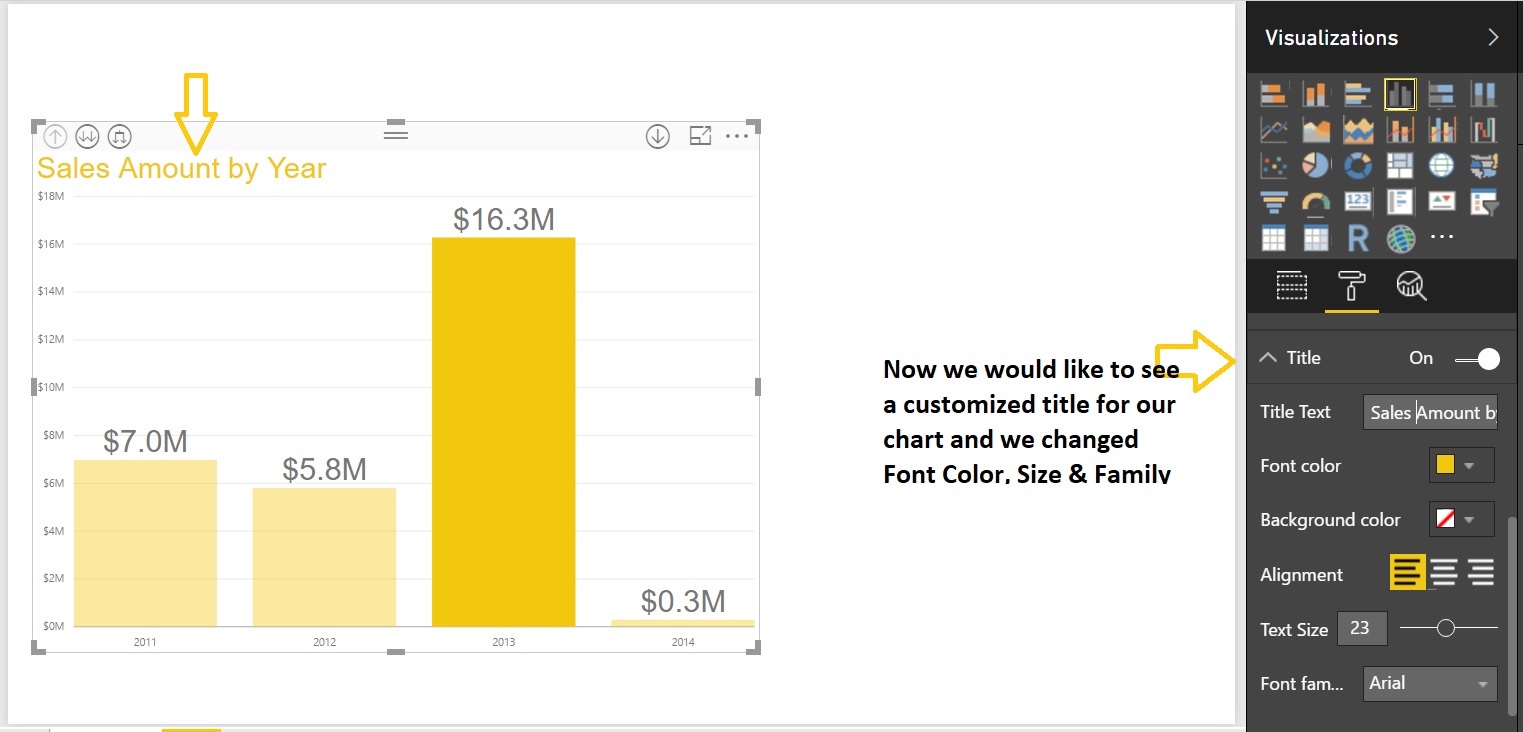
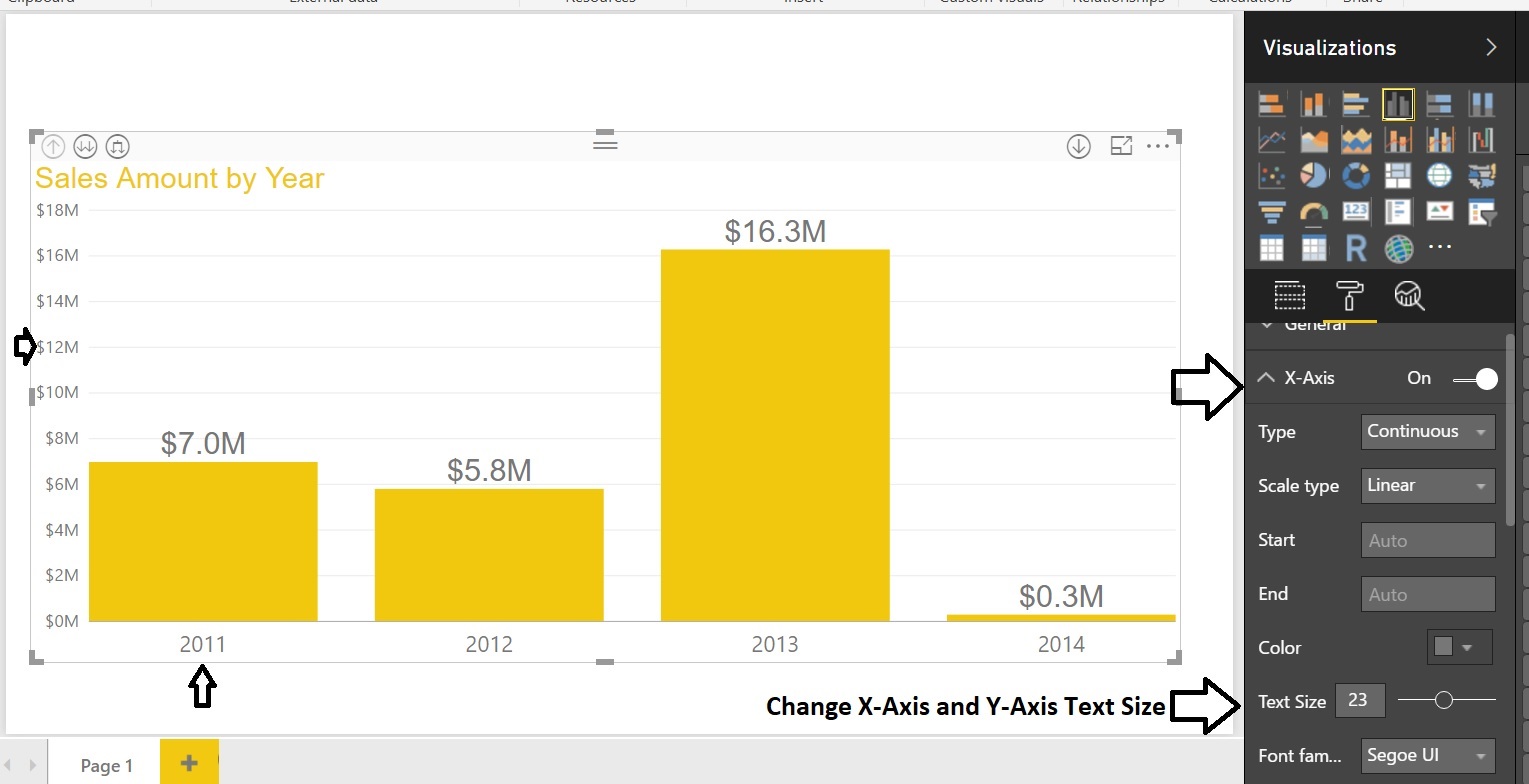
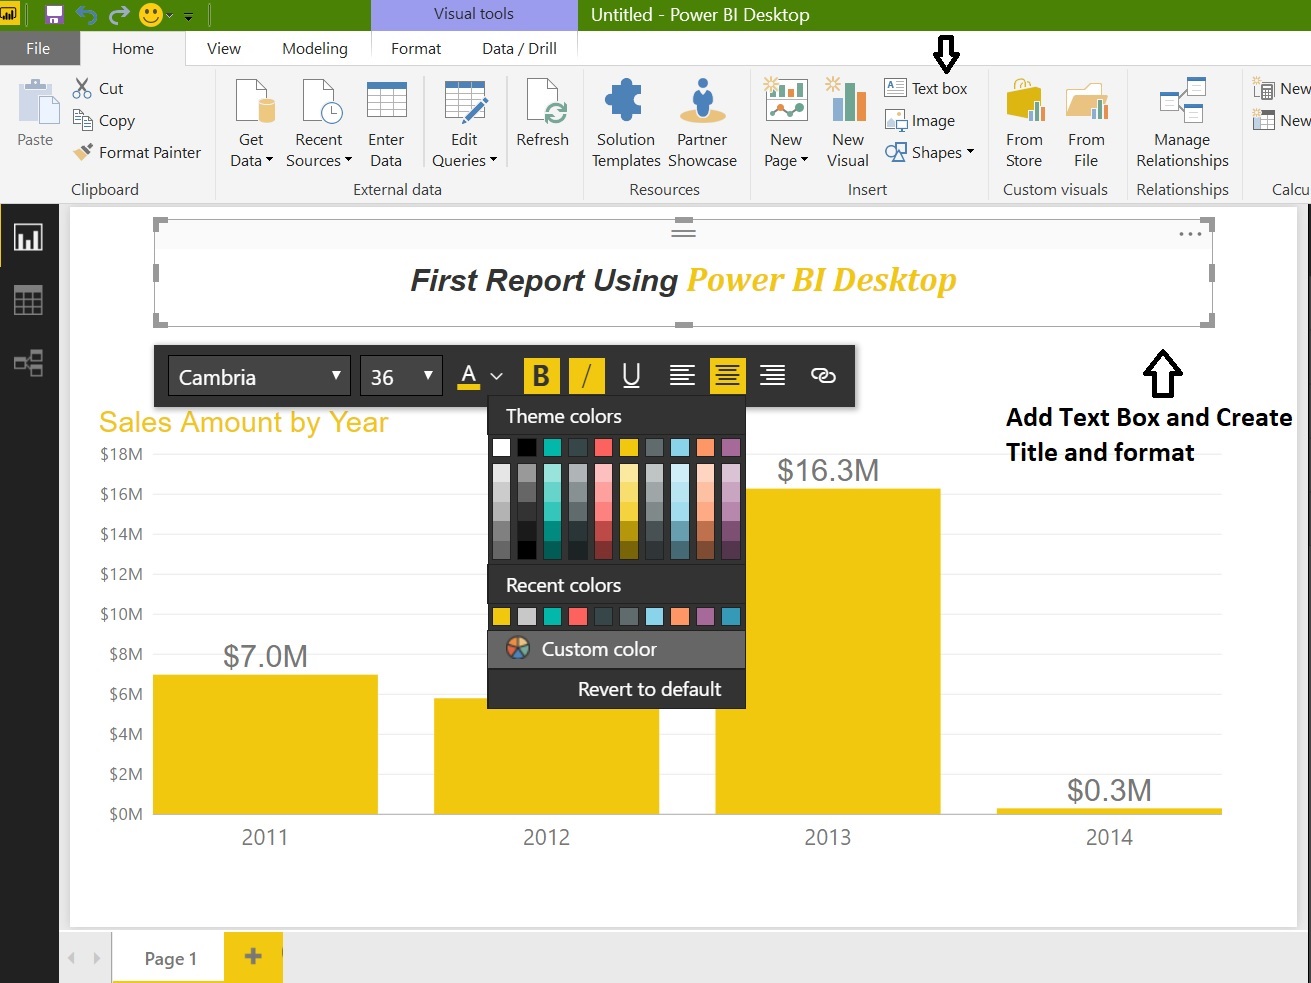
Now change the Chart data colors, Format the Chart Title, X-Axis, Y-Axis text size etc. Select the Chart and go to Format tab:

Learning Microsoft Power BI Lesson 3 Learning Microsoft Power BI Lesson 3 Learning Microsoft Power BI Lesson 3 Learning Microsoft Power BI Lesson 3

Finally add a Text box to the report also change the Page name to MyFirstReport:

Learning Microsoft Power BI Lesson 3 Learning Microsoft Power BI Lesson 3

Summary:

  • Started interacting with Power BI Desktop
  • Seen various parts of Power BI Desktop
  • Loading data from SQL Server to Power BI Desktop
  • Creating a simple report with a single visualization
  • Applied few formations to report
  • You can play with more options and get yourself free with the Power BI environment

In Next lesson we’ll start interacting with Power BI Cloud based Service

Power BI Lesson 1

Power BI Lesson 2

Power BI Introduction

Posted in MSBI, Power BI, SQL Development | Tagged , , , , , , , , | 4 Comments

Learning Microsoft Power BI Lesson 2

Learning Microsoft Power BI Lesson 2

The post “Learning Microsoft Power BI Lesson 2” takes you through installing and connecting to “Power BI Desktop” and “Power BI Service”.

Power BI – Desktop:

This is a windows desktop application and we can download and install from here:

Learning Microsoft Power BI Lesson 2

This is a straight forward process to install Power BI Desktop. Once you download the file and install it:

Learning Microsoft Power BI Lesson 2 Learning Microsoft Power BI Lesson 2 Learning Microsoft Power BI Lesson 2 Learning Microsoft Power BI Lesson 2 Learning Microsoft Power BI Lesson 2

Now we installed Power BI desktop, we’ll explore these options in next lesion. Now we’ll see how to connect to Power BI Service.

Power BI Service:

This is a cloud based (SaaS) service where we can create, publish and share reports with in your organization. As per the Power BI work flow, we create reports using Power BI Desktop, publish reports to Power BI Service and Share reports with others so that they can view reports in the BI service or on Power BI Mobile App.

But setting up / signing up to Power BI service is not that easy as it’s only available with Pro Version license. But we can try with 60-Day trial version.

Here you can sign-up to Power BI Service:

Learning Microsoft Power BI Lesson 2 Learning Microsoft Power BI Lesson 2 Learning Microsoft Power BI Lesson 2

Here the problem is we can’t use the personal email to sign up with Power BI Service rather we should use a work or office email.

  • If you want to sign-up using your office email ID, check with your office policy and take the required approval from the enterprise (Infosec / Audit / Security) team
  • Try setting up a free account at Office 365 then we can use that email account to sign-up to Power BI Service Pro version.
  • Setup trial for Office 365 “Home” & “Portal

 Once you are ready with the required email ID then sign up for Power BI Service:

Learning Microsoft Power BI Lesson 2 Learning Microsoft Power BI Lesson 2

Summary:

  • We understand how to download and Install Power BI Desktop
  • Setting up a new account and signing to Power BI Service
  • Setting up Office 365 account for a trial version and we used that account for logging into Power BI
  • Even the Office 365 account expired the same account will work with Power BI

Now we all set with Power BI Desktop and Power BI Service, in Lesson 3 we’ll start exploring options for Power BI Desktop

About Power BI, Power BI Introduction

Posted in MSBI, Power BI, SQL Development | Tagged , , , , , | 3 Comments

Learning Microsoft Power BI Lesson 1

Learning Microsoft Power BI Lesson 1

The post “Learning Microsoft Power BI Lesson 1” is the introduction lesson for Power BI. We would like to concentrate more on implementing rather than theory but before that we should understand basic things:

Q. Where we can find the Power BI software?

Ans:

Here is the link to download Power BI desktop cersion.

Click on Start Free Download Free

Install the downloaded software

Q. Does Microsoft provides any documentation / Tutorial?

Ans:

Yes! Microsoft is providing the guided learning tutorial

Here is the link for the Microsoft Power BI Tutorial.

Q. What are the main components of Power BI?

Ans:

Below are the components of Power BI. These are released to market separately also we can use these components individually.

Power BI Desktop: Desktop application for developing BI reports

Power BI Service: SaaS (Soft as a Service) cloud based solution for authoring and sharing the BI reports

Power BI Mobile App: Power BI supports mobile OS Android, iOS and Windows.

Power Query: Is a free add-in for Excel (2010 & 2013) and embedded in Excel 2016. It allows users an easy way to discover, combine and refine data all within the familiar Excel interface.

Power Pivot: Is an In-memory tabular data modelling tool, it’s a free add-in for Excel 2010 and embedded from Excel 2013 and higher.

Power View: It’s a data visualization tool that lets you create interactive charts, graphs, maps, and other visuals. It’s a free add-in from Excel 2013

Power Map: It’s a 3 Dimensional data visualization tool. It’s a free add-in for Excel 2013 and embedded as a “3D Maps” in Excel 2016

Power Q&A: Natural language question and answering engine, it doesn’t require any separate installation or add-in.

Q. What are the Building Blocks of Power BI?

Ans:

Before going to learn designing the first reports we should understand the building blocks of Power BI. Below are the basic building blocks in Power BI:

  • Visualizations
  • Datasets
  • Reports
  • Dashboards
  • Tiles

Visualizations: A visualization (sometimes also referred to as a visual) is a visual representation of data, such as a chart, a graph, a color-coded map, or other interesting things you can create to represent your data visually. Below image shows a collection of different visualizations regarding travel analysis:

Learning Microsoft Power BI Lesson 1

Dataset: Is a source / Input for Power BI to create visualizations. It can also get data from multiple sources such as SQL Server, Excel, MySQL etc.

Reports: A report is a collection of visualizations that appear together in one or more pages. Ex: Representing product sales for a division. Based on the business requirement we can represent and organize visualizations in one or more pages. Below we are viewing the Page 3 from a 6page report:

Learning Microsoft Power BI Lesson 1

Dashboards: A dash board represents a single page from a report or a group of visualizations. It’s just like a Dashboard in Cricket, in your Car, your user dashboard in Insurance portal, e-store user dashboard etc.

Tiles: A tile is a single visualization in a dashboard. It’s the rectangular box that contains each individual visual.

Summary:

Here in this introduction lesson we have gone through:

  • Power BI software details
  • Microsoft tutorial details
  • Power BI Components
  • Building Blocks of Power BI

In Next Lesson we will focus on setting up Power BI Desktop and Power BI Service.

Posted in Power BI, SQL Development | Tagged , , , , | 5 Comments